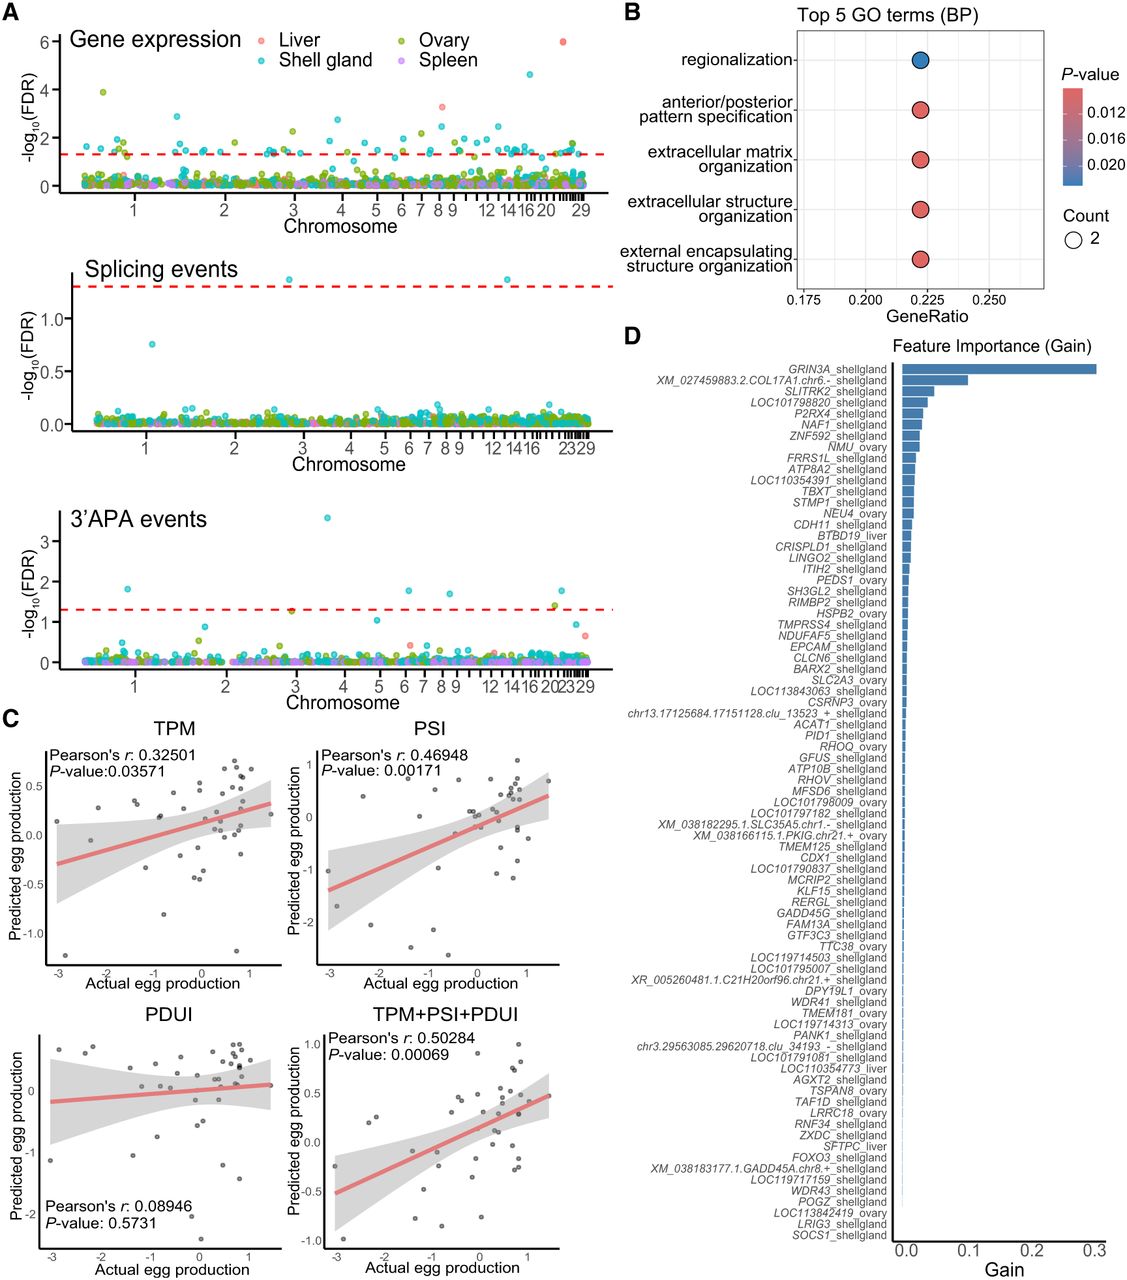
TWAS and egg production prediction. (A) Manhattan plots of TWAS results. The x- and y-axes represent chromosomal positions and significance levels (−log10FDR), respectively. From top to bottom, the points represent genes, alternative splicing events, and 3′APA events. Different colors indicate different tissues. (B) GO enrichment analysis of genes annotated by all molecular phenotypes associated with egg production. (C) Evaluation of prediction accuracy for models constructed using different molecular features. Each point represents an individual in the test set. The x- and y-axes represent standardized actual and predicted egg production, respectively. (D) Feature importance ranking in the predictive model based on multilayer regulatory features. The x-axis indicates feature contribution (gain), and the y-axis shows the molecular phenotypes included in the model.