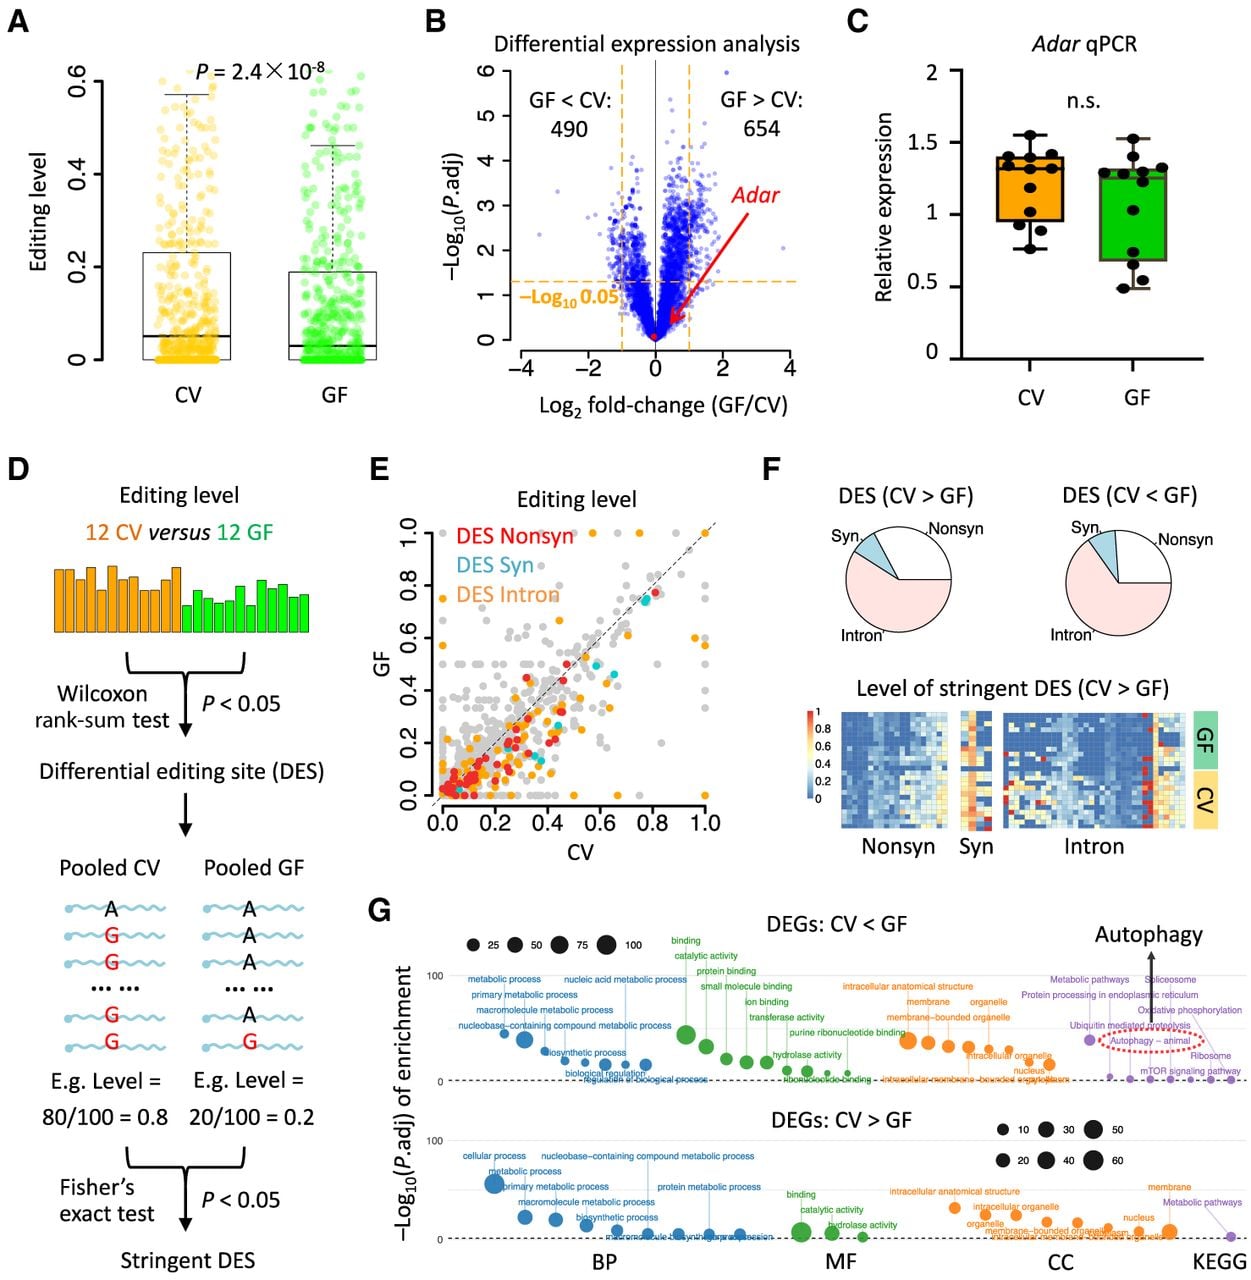
Differential RNA editing between CV and GF. (A) Boxplots showing the overall distribution of pooled editing levels in CV and GF samples. The P-value was calculated by paired Wilcoxon rank-sum test. (B) Volcano plots for differential expression analysis on 12 CV and 12 GF samples. The x-axis represents the log2 fold-change (GF/CV) in gene expression. The y-axis represents the log10-transformed adjusted P-value. The orange dashed line represents the threshold of significance. The Adar gene is labeled in red. (C) Barplots showing Adar expression levels measured by qPCR in 12 CV and 12 GF samples. The P-value was calculated by a t-test. (D) Procedures of defining differential editing sites (DESs). A Wilcoxon rank-sum test comparing 12 CV and 12 GF samples was applied to the editing level of each site. Sites with P < 0.05 were defined as DESs. Fisher's exact tests were then applied to the pooled allele counts of CV and GF. DESs with P < 0.05 were further defined as stringent DESs. (E) Scatterplot showing the editing levels in CV and GF. Levels from pooled reads were used. Colored sites are DESs belonging to different genomic categories. (F) Pie charts showing the annotation of DESs and heatmap illustrating the editing levels of stringent DESs with CV > GF. (G) Functional enrichment of significantly up- and downregulated genes in GF. Circle size represents number of genes. (BP) Biological process; (MF) molecular function; (CC) cellular component.