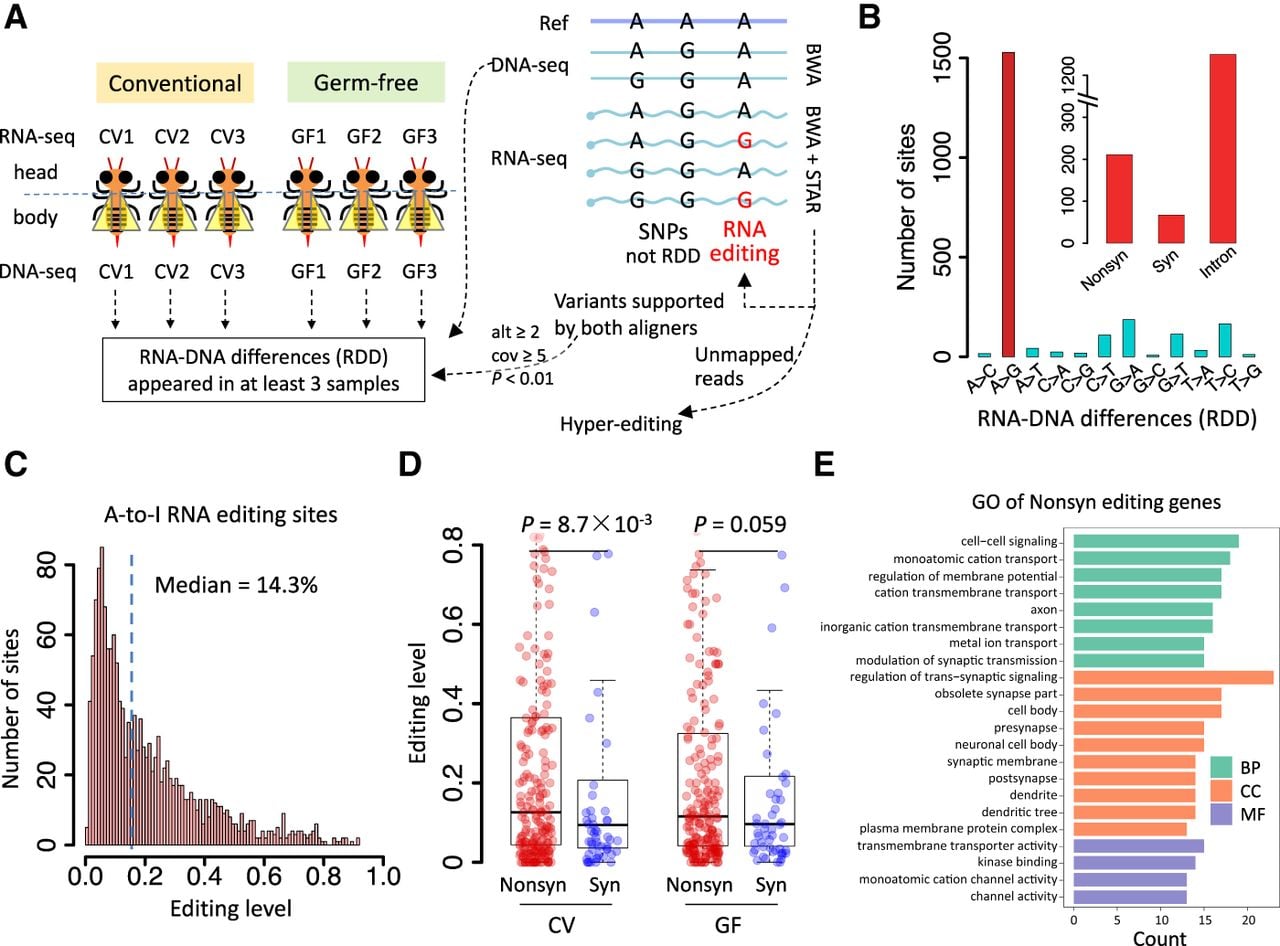
A-to-I RNA editomes of honey bee samples. (A) Scheme of identifying A-to-I RNA editing sites in the honey bee samples. Three conventional (CV) and three germ-free (GF) samples were used. Heads were used to construct RNA-seq libraries, and bodies were subjected to DNA resequencing. The reliable RNA–DNA differences (RDDs) were regarded as RNA editing sites. (B) The number of different types of mismatches in the RDDs. Only the RDDs in the genic region were considered. A-to-G RDDs represent A-to-I RNA editing sites. The numbers of A-to-I editing sites for each functional category are shown in a barplot. (C) Histogram showing the distribution of editing levels of A-to-I RNA editing sites. (D) Comparison of editing levels of nonsynonymous and synonymous sites in CV and GF honey bees. P-values were calculated by Wilcoxon rank-sum tests. (E) GO enrichment of genes with nonsynonymous editing in honey bee samples.