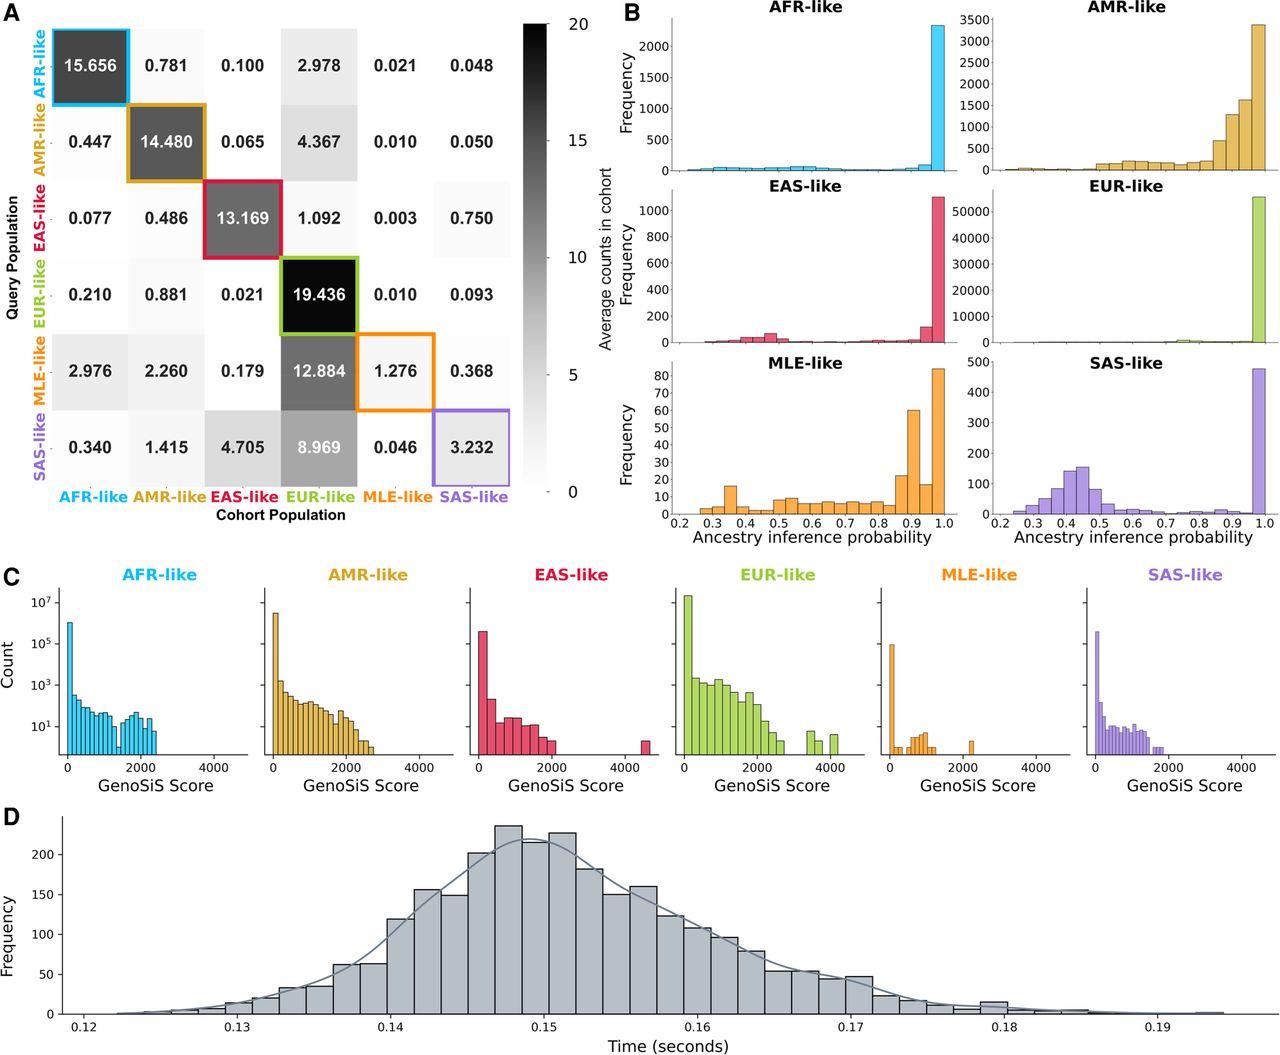
Figure 6.
Average occurrence of each population for CCPM cohorts of size 20. (A) Average CCPM group counts for cohorts generated by GenoSiS plotted as a heatmap. Group labels for the query samples are listed on the left axis, and the labels of sample that appear in their GenoSiS cohort appear on the bottom axis. (B) CCPM ancestry inference probabilities for CCPM populations. (C) GenoSiS scores for CCPM groups. (D) GenoSiS search and aggregation times for CCPM's 73,346 biobank samples.