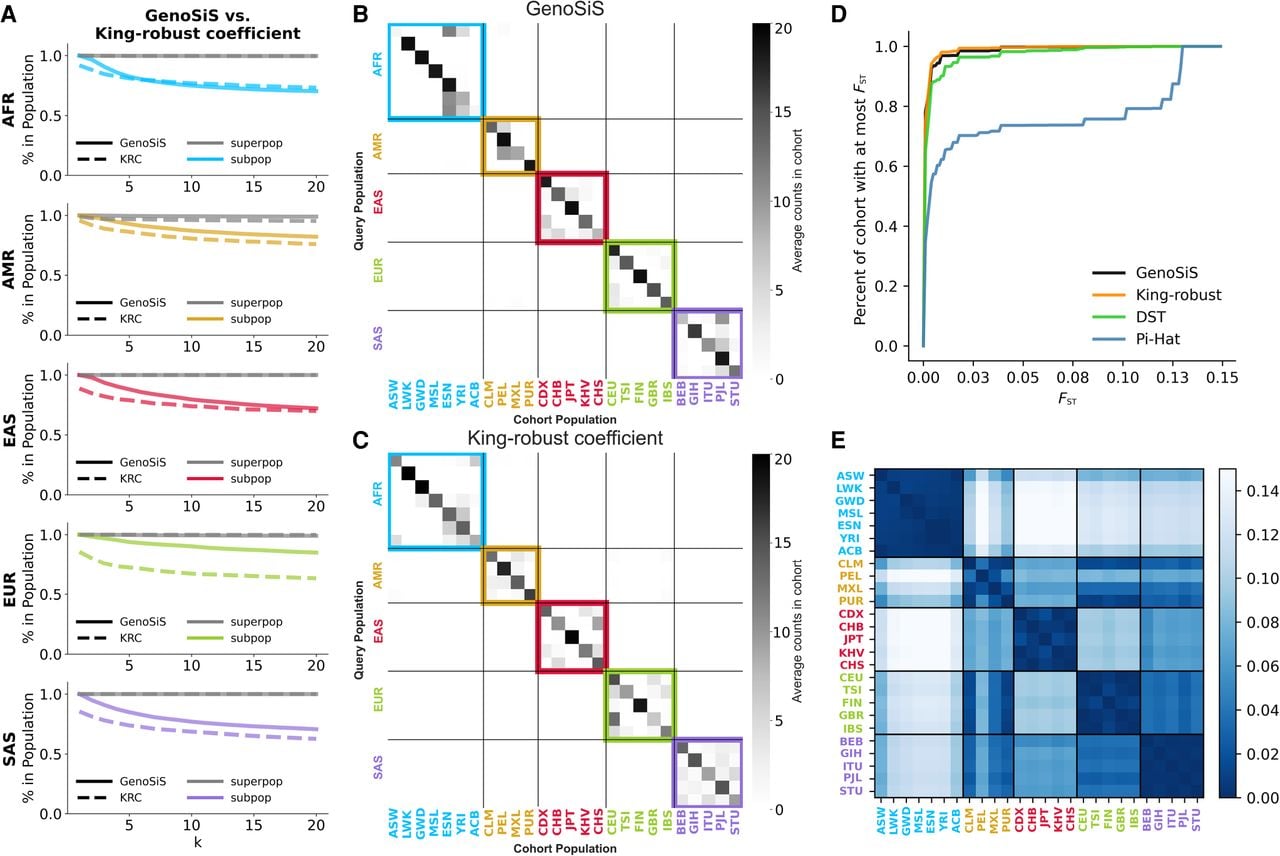
Analysis of 1KGP cohorts. (A) Percentage of samples from the 1KGP cohorts which are in the super- and subpopulations of the query samples as the size of the cohorts increases from one to 20. GenoSiS is plotted as a solid line, and the King-robust coefficient is plotted as a dashed line. Lines for superpopulations are plotted in gray, and lines for subpopulation are plotted in a color corresponding to the population. (B,C) Average subpopulation counts of appearances in cohorts generated by GenoSiS (B) and King-robust coefficient (C). For both B and C, superpopulation labels for query samples are listed on the vertical axis and are colored accordingly. Subpopulation labels for samples in the representative cohort are listed on the horizontal axis and are colored according to their respective superpopulation. FST is a statistical measure of genetic differentiation between populations (Privé et al. 2022). (D) Empirical distribution function tracking the percentage of samples identified by three comparison methods that were from subpopulations with an FST value less than equal to than a specified threshold. For instance, 78% of samples identified by GenoSiS were from populations with an FST ≤ 0.001, King-robust had 75.2%, DST had 64.8%, and pi-Hat had 34.6%. A lower FST and darker blue color indicates higher genetic similarity. (E) FST for all 1KGP subpopulations grouped by superpopulation. Cohort size k = 20 for all scenarios.