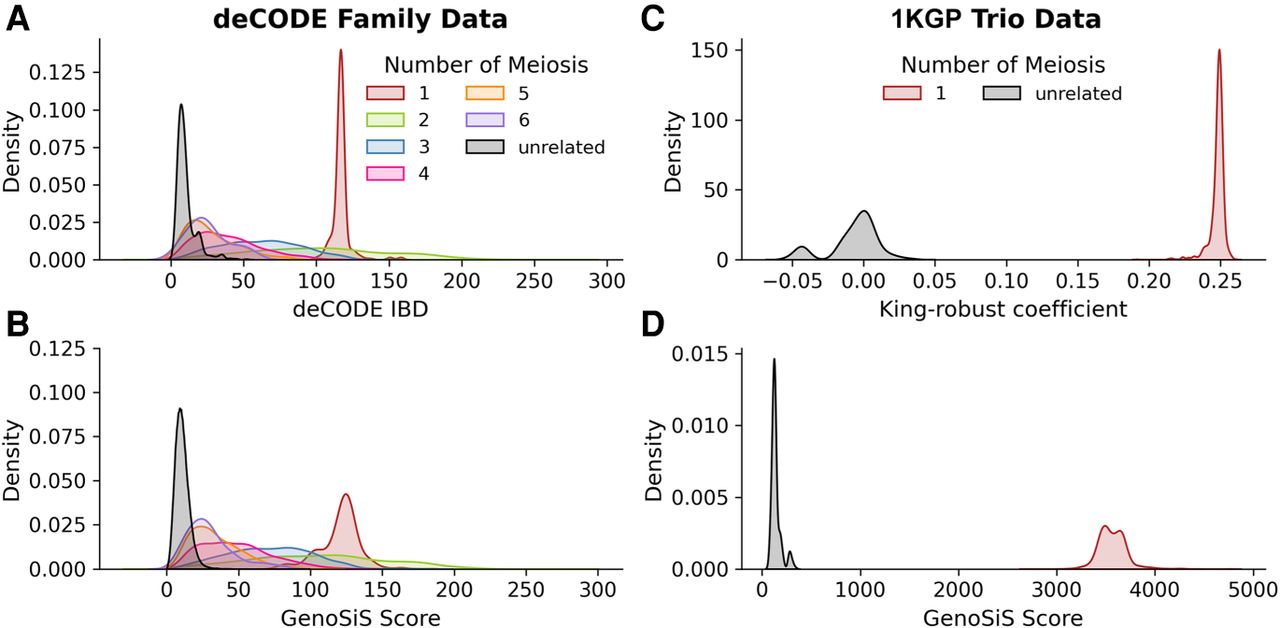
Genetic distance distributions among closely related samples. (A,B) deCODE IBD (A) and GenoSiS score (B) distributions for deCODE families. (C,D) King-robust coefficient (C) and GenoSiS score (D) distributions for 1KGP trios. The deCODE IDB and GenoSiS score ranges correspond to the number of centimorgans considered, whereas the King-robust coefficient is normalized such that first-degree relatives have a score of about 0.25, second-degree relatives a score of about 0.125, and so forth. (A,B) Two haplotypes for Chromosome 18. (C,D) All autosomes. Distributions plotted and colored by numbers of meiotic events separating two samples in which the number of meiotic events corresponds to family relationships (e.g., 1 = parent/child, 2 = grandparent/grandchild, full-siblings, etc.). All cohorts were size 20.