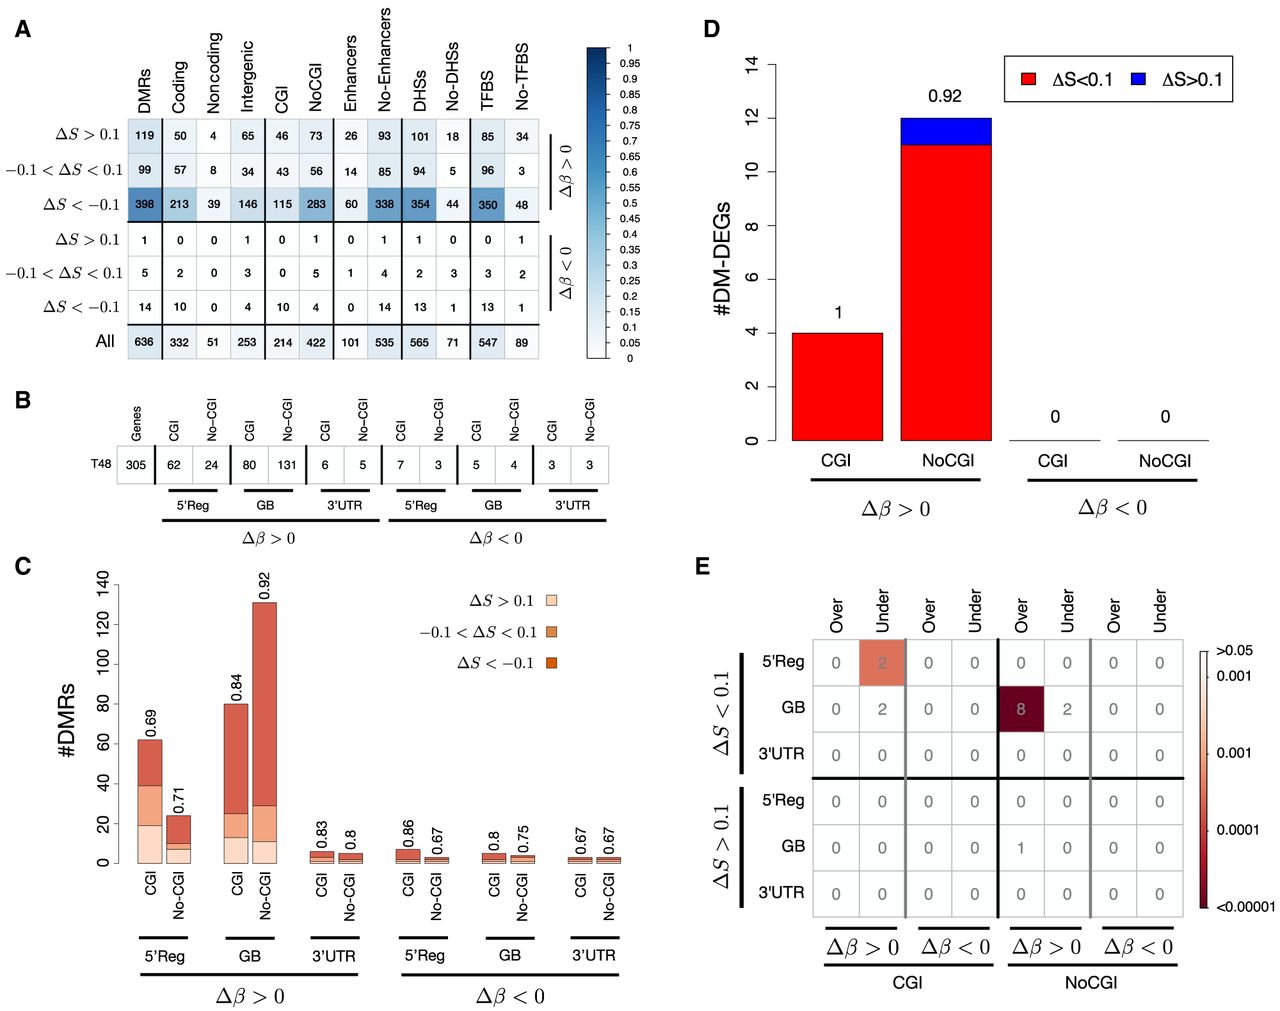
DMRs of the HPGC samples. (A) The number of DMRs identified for each of the six categories defined by Δβ and ΔS values. The plot reports the number of DMRs overlapping each genic (coding, noncoding, and intergenic) and regulatory (CGI, enhancer, DHS, TFBS) element class, and the color intensity in each cell reflects the proportion of DMRs of a category with respect to all DMRs according to the colorbar. (B) The number of DMGs affected by hypermethylated (Δβ > 0.2) and hypomethylated (Δβ < −0.2) DMRs overlapping different genic features (5′Reg, GB, and 3′ UTR), outside and inside CGIs. The bar plot in C displays the number of DMGs reported in B, further categorized as hyperentropic (ΔS > 0.1), isoentropic (−0.1 < ΔS < 0.1), and hypoentropic (ΔS < −0.1). (D) The proportion of DM-DEGs with hyperentropic (ΔS > 0.1) and iso- or hypoentropic (ΔS < 0.1) DMRs. Results are reported for hypermethylated (Δβ > 0.2) and hypomethylated (Δβ < −0.2) DMRs overlapping CGIs and outside CpG islands (NoCGI). (E) The results of ORA for DM-DEGs. The analysis was performed separately for genes affected by DMRs at the 5' regulatory region (5'Reg), the gene body (GB), and the 3' UTR and for DMRs overlapping CpG islands (CGI) and outside CpG islands (NoCGI). The blocks of the corrplot report the results of ORA for different classes of DMRs formation: Δβ > 0.2 and ΔS < 0.1 (hypermethylated and hypo- and isoentropic), Δβ > 0.2 and ΔS > 0.1 (hypermethylated and hypo- and isoentropic), Δβ < −0.2 and ΔS < 0.1 (hypomethylated and hypo- and isoentropic), Δβ < −0.2 and ΔS > 0.1 (hypomethylated and hypo- and isoentropic). The numbers in each cell represent the total number of DM-DEGs for each category, and the color intensity reflects statistical significance according to colorbar.