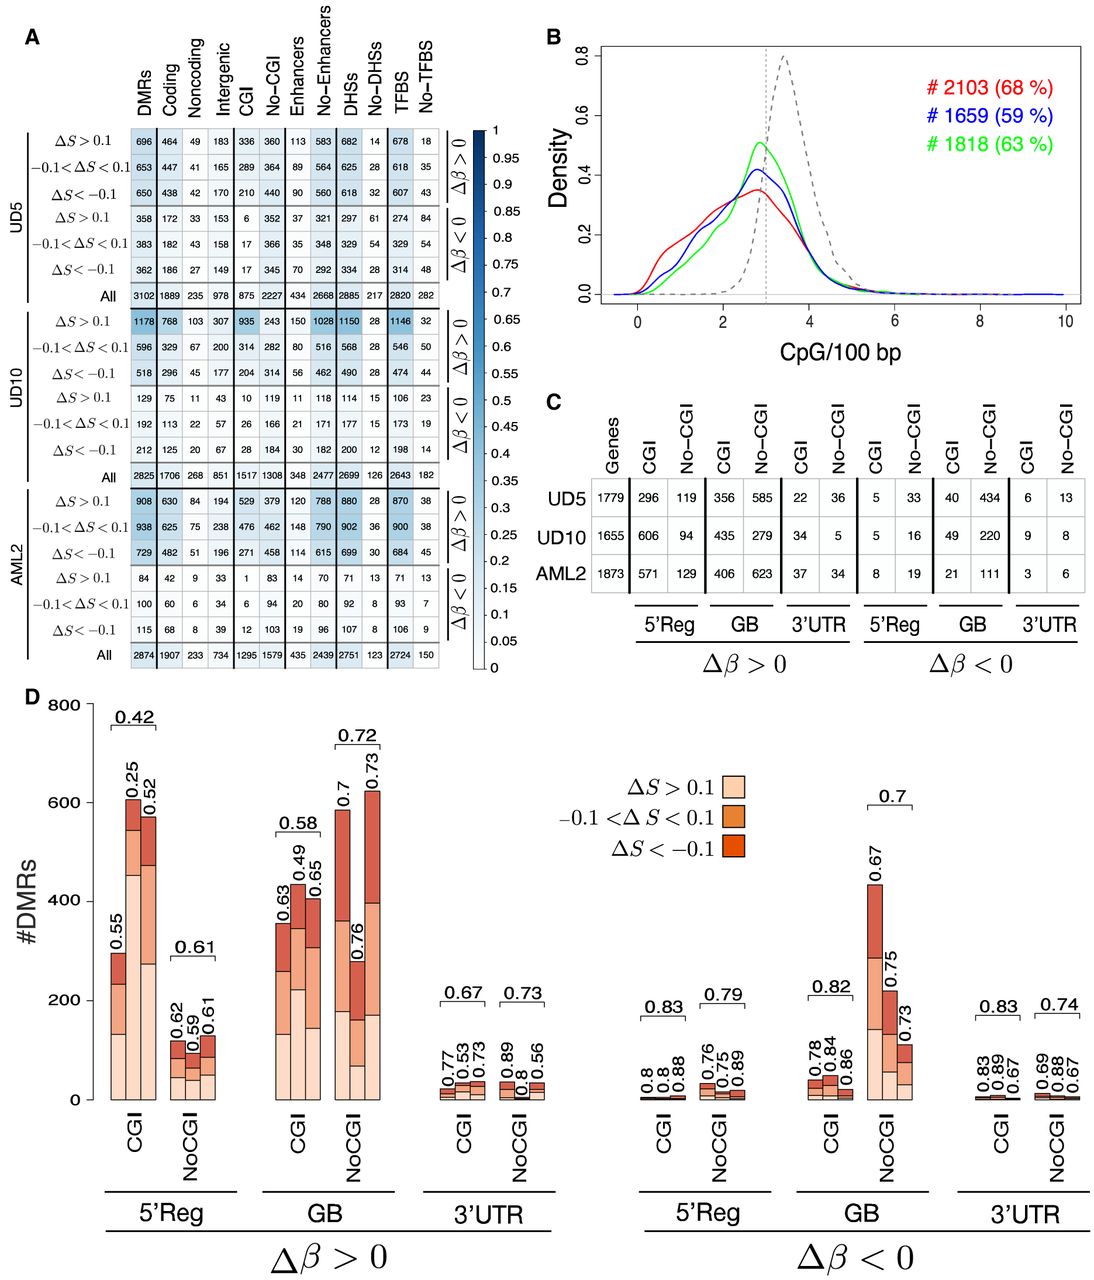
DMRs of the three pairs of AML samples. (A) The number of DMRs detected by BiSLM in the three AML pairs for all the six categories reflecting Δβ (hypermethylation, Δβ > 0.2; hypomethylation, Δβ < −0.2) and ΔS (hyperentropic, ΔS > 0.1; isoentropic, −0.1 < ΔS!0.1; hypoentropic, ΔS < −0.1) variations. Numbers are reported for DMRs overlapping protein-coding genes (coding), noncoding genes (noncoding), intergenic regions (intergenic), CpG islands (CGIs), enhancers, DNase I hypersensitive sites (DHSs), and transcription factor binding sites (TFBSs). (No-CGI, no-enhancers, no-DHSs, and no-TFBS) The number of DMRs that do not overlap with CGI, enhancers, DHSs, and TFBS, respectively. The color intensity in each cell reflects the proportion of DMRs of a category with respect to all DMRs for each sample according to the colorbar. (B) CpG density distribution of the DMRs detected by BiSLM on the three pairs of AML samples. The vertical dotted line indicates ERRBS resolution limit (three or fewer CpGs per 100 bp). Text on left side of the plot reports the total number (#) and on the right side the percentage (%) of DMRs detected by PoreMeth with CpG density of two or fewer CpGs per 100 bp (left) or three or fewer CpGs per 100 bp (right). The table of C reports the total number of DM genes with DMRs at different genomic elements (5′ regulatory region [Reg], internal introns and exons [GB], 3′ UTR) inside CGIs and outside CpG islands (NoCGIs). The bar plot of panel D reports the number of hyperentropic (ΔS > 0.1), hypoentropic (ΔS < −0.1), and isoentropic (−0.1 < ΔS < 0.1) epiallelic changes for hyper- and hypomethylated genes with DMRs overlapping different genic elements at CGI and sparse CpGs (NoCGIs). Numbers above bars show the percentage of hypoentropic (ΔS < −0.1) or isoentropic (−0.1 < ΔS < 0.1) DMGs. Horizontal brackets above each group of three bars summarize average percentages of the three samples.