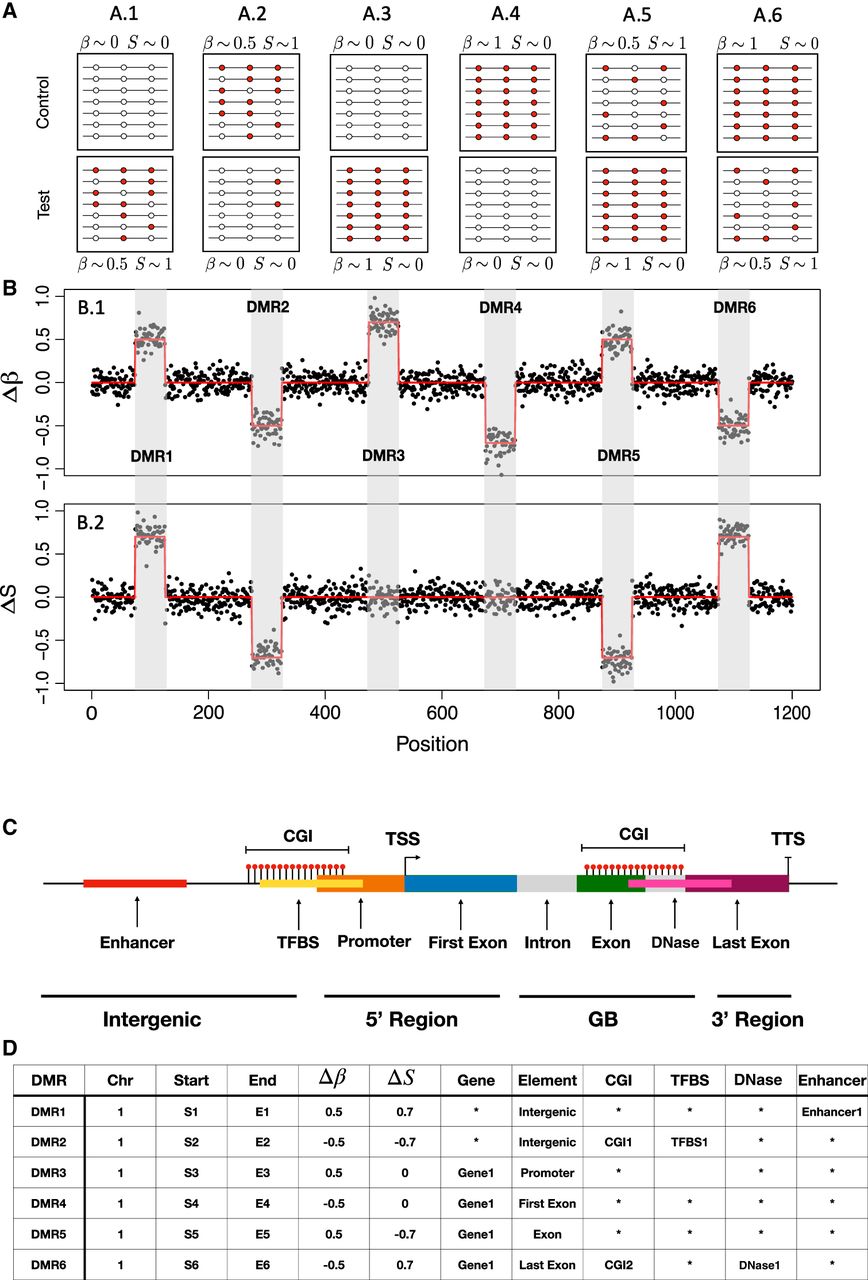
Computational workflow of PoreMeth2. (A) A schematic representation of the six possible epiallelic changes between test and control samples: hypermethylation with entropy increase (ΔS > 0.1 and Δβ > 0, A.1), hypomethylation with entropy decrease (ΔS < 0 and Δβ > 0, A.2), hyper- and hypomethylation with no entropy change ( and Δβ > 0, A.3, and Δβ < 0, A.4), hypermethylation with entropy decrease (ΔS < −0.1 and Δβ > 0, A.5), and hypomethylation with entropy increase (ΔS > 0 and Δβ < 0, A.6). PoreMeth2 takes as input the methylation calls from Nanopolish, Guppy, or Dorado and calculates methylation frequency and entropy. (B) Δβ (B.1) and ΔS (B.2) signals calculated for each CpG dinucleotide and ordered for genomic position. The two signals show six DMRs that reflect the epiallelic diversity changes reported in A. To identify epiallelic composition changes the two signals xi are modeled with SLM as the sum of two independent stochastic processes (xi = mi + εi), where mi = (mi1, mi2) is the vector of the unobserved mean level, and εi is the vector of white noises. The white noise vector εi follows a bivariate normal distribution with mean με = [0] and covariance matrix Σε; zi are random variables taking the values in [0,1] with probabilities η = Pr(zi = 1) (1 − η = Pr(zi = 0)); δi are random vectors that follow a bivariate normal distribution, and μi is the vector of the means (see Methods). DMRs identified with the bivariate version of the SLM algorithm can then be annotated with a scheme that reports all the genic elements overlapping a DMR, and for each of these elements, it calculates the overlap with regulatory feature (CGI, enhancers, TFBS, and DHS). (C) The gene model used for PoreMeth2 annotation and (D) the annotation results of the six DMRs.