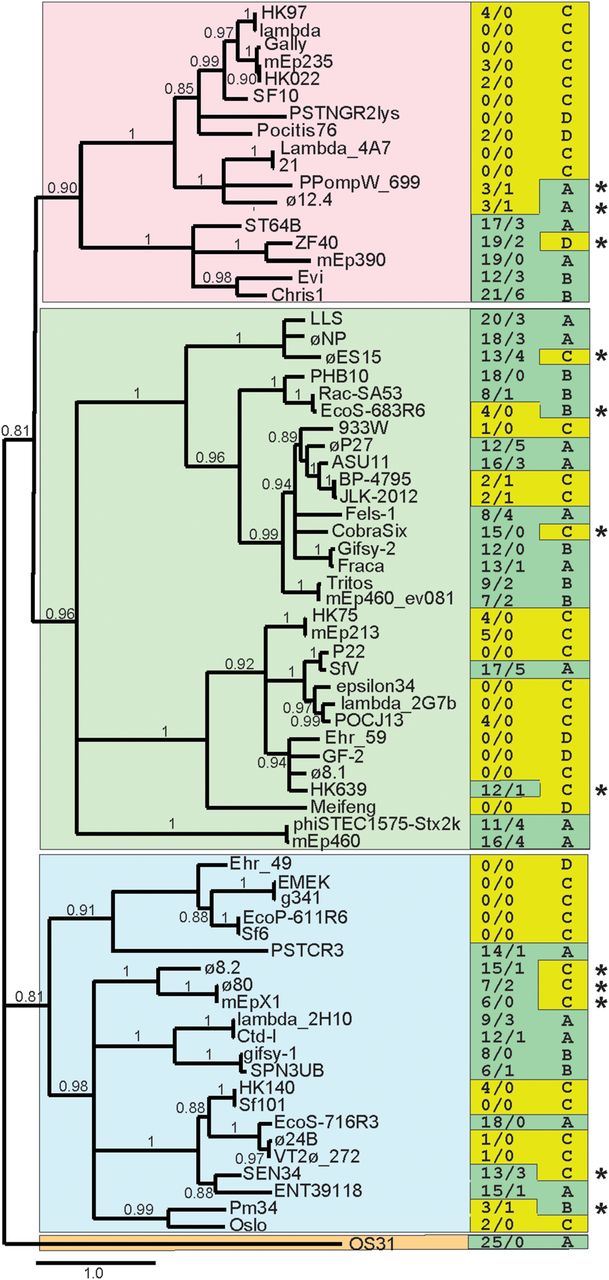
Correlation of integrase protein sequence with occurrence of Rec modules and Chi sites. BLASTP analysis (Altschul et al. 1997) was used to identify the integrase proteins encoded by the Enterobacteriales phages in Suppelmental Table S3. A sample of these proteins, chosen before (i.e., independently of) analysis of the phages’ Rec modules and Chi sites, that represents the extent of the panel's integrase diversity was used to generate a maximum-likelihood phylogenetic tree at http://www.phylogeny.fr/ (PhyML program as implemented by Dereeper et al. 2008). Phage names are given at the right of each branch; bootstrap values (0.0 to 1.0) are shown in the tree; branches with bootstrap values less than 0.80 are collapsed; a scale bar of estimated evolutionary distance (changes per site) is shown at the bottom of the figure; and the four major integrase clades are indicated by different background colors. In the right-hand columns, the numbers of Chi sites in the two strands (upper/lower) (Suppelmental_Table_S3) are indicated on the left, and Rec module type as defined in Table 1 is shown on the right. Green and yellow left column background colors highlight high and low numbers of Chi sites, respectively; green and yellow right column backgrounds indicate Table 1 classes whose members usually have high and low numbers of Chi sites, respectively. Asterisks mark 12 phages in which the number of Chi sites is unusual for its Rec module class; eight of these are in Figure 7 (left panel), which suggests they are evolving between Class A or B and Class C.