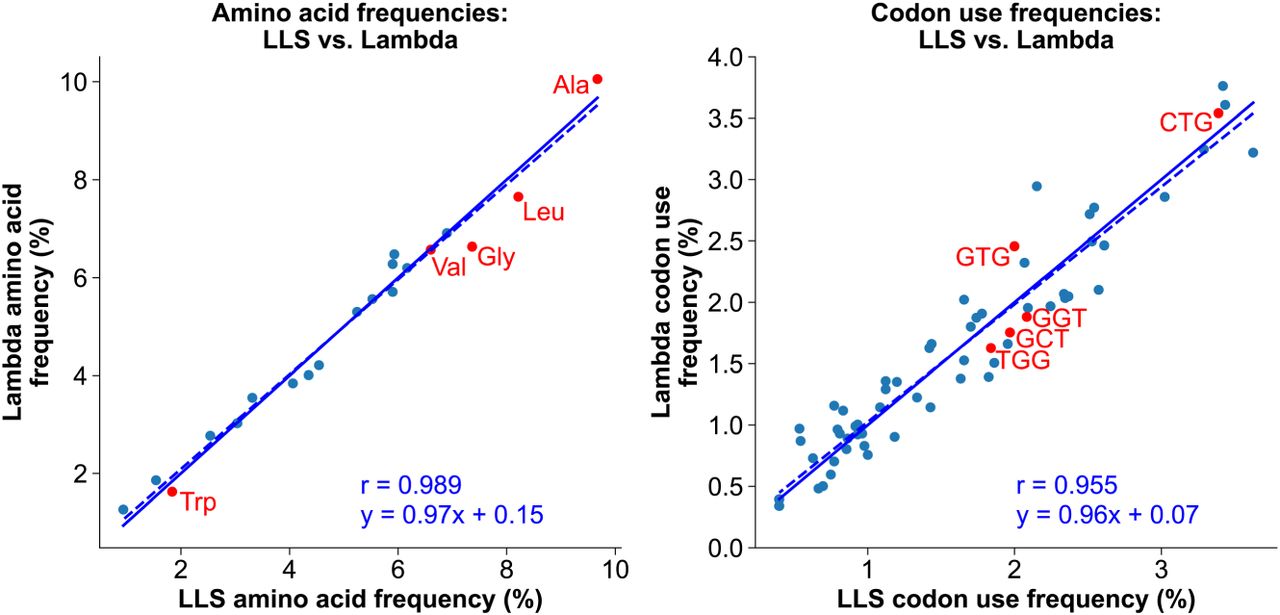
Figure 6.
Amino acid and codon frequencies are highly similar in bacteriophage λ (with no Chi sites) and phage LLS (with 23 Chi sites). The frequencies of encoded amino acids (left) and codons (right) in λ are plotted versus their frequencies in LLS. Note that the slope of the linear regression line (dotted line) is nearly equal to one, which would indicate equality (solid line). The Pearson regression coefficients (r) indicate high correlation. Red dots indicate codons within Chi (right) and their encoded amino acids (left).