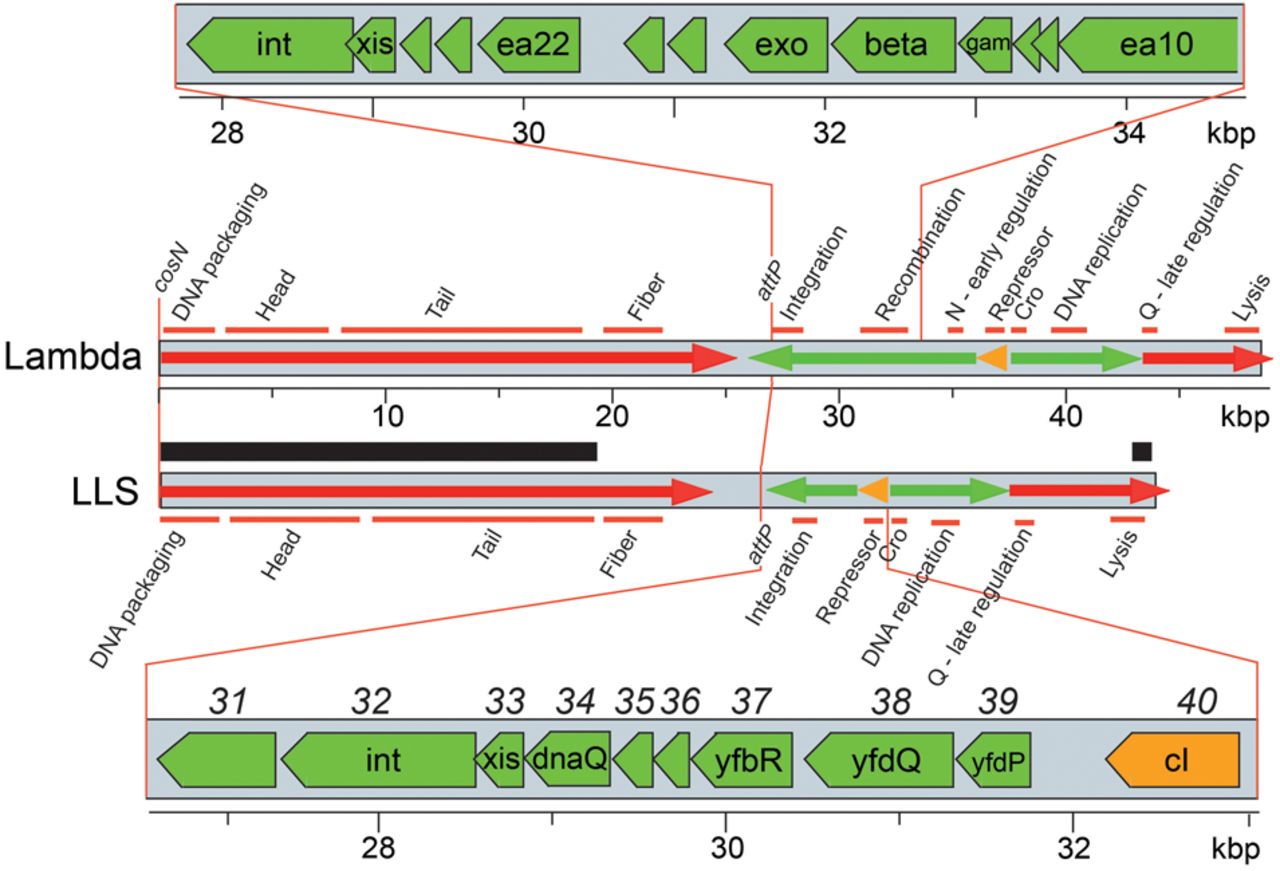
Map of the phage LLS genome. The gray rectangles represent phage LLS and bacteriophage λ genomes. Green and red arrows indicate early and late transcription, respectively, and the orange arrows indicate repressor transcripts from the prophages. Gene functions are shown above and below the two maps; gene modules encoding proteins of related function, such as formation of phage heads, are indicated by horizontal orange bars. The thick black bar above the LLS genome marks the region of 98% identity to the phage mEp213 genome (Kameyama et al. 1999). The open reading frames in the early left operon regions are expanded at the top and bottom. Note that λ has a Rec module, with exo, beta, and gam, between the integration genes and the cI repressor gene, whereas LLS has genes of unrelated function (see text). LLS genes at the bottom are indicated by names within the green arrows and by numbers above the gray bar.