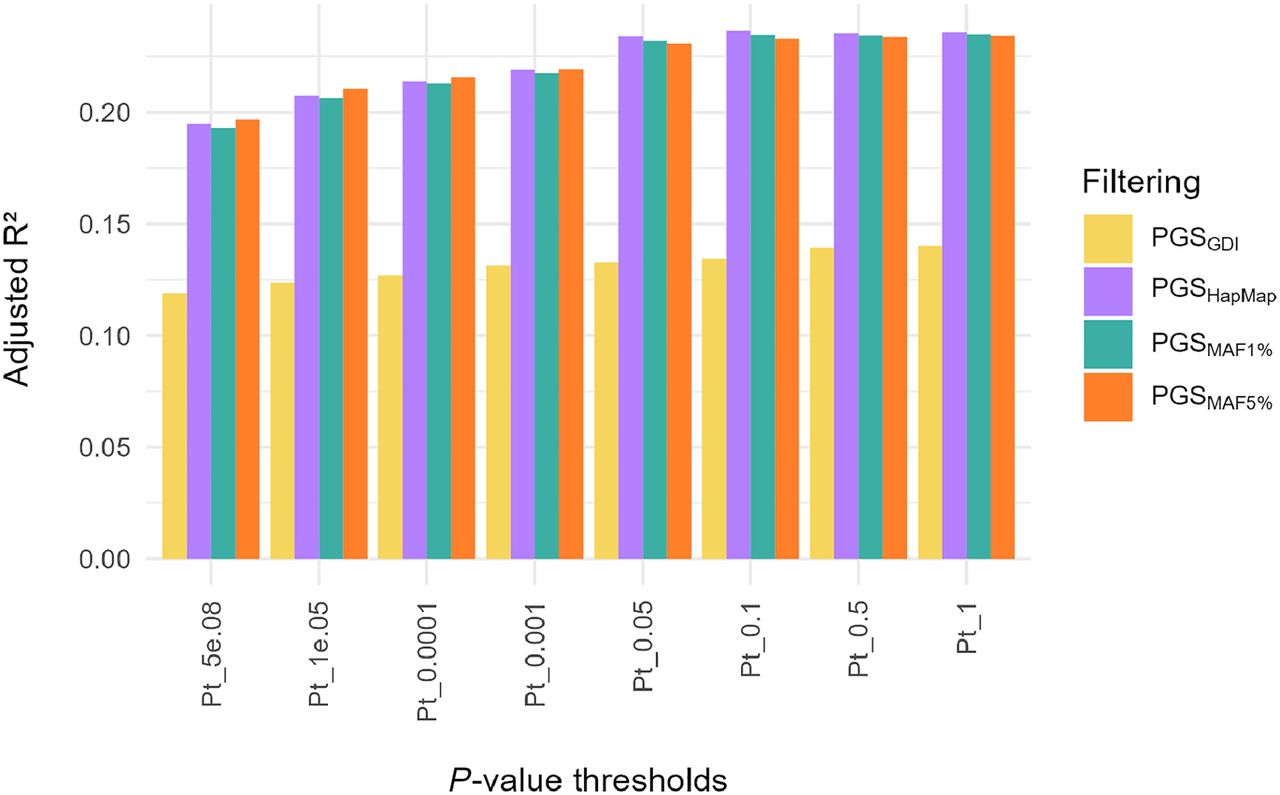
Figure 6.
Phenotypic variance in height explained by the PGS per P-value threshold and for different filtering approaches. The overall best performing PGS in terms of variance explained is PGSHapMap at P-value threshold (Pt) 0.1 with an r² of 0.237 (beta = 0.03, P-value = 2.83 × 10−114).