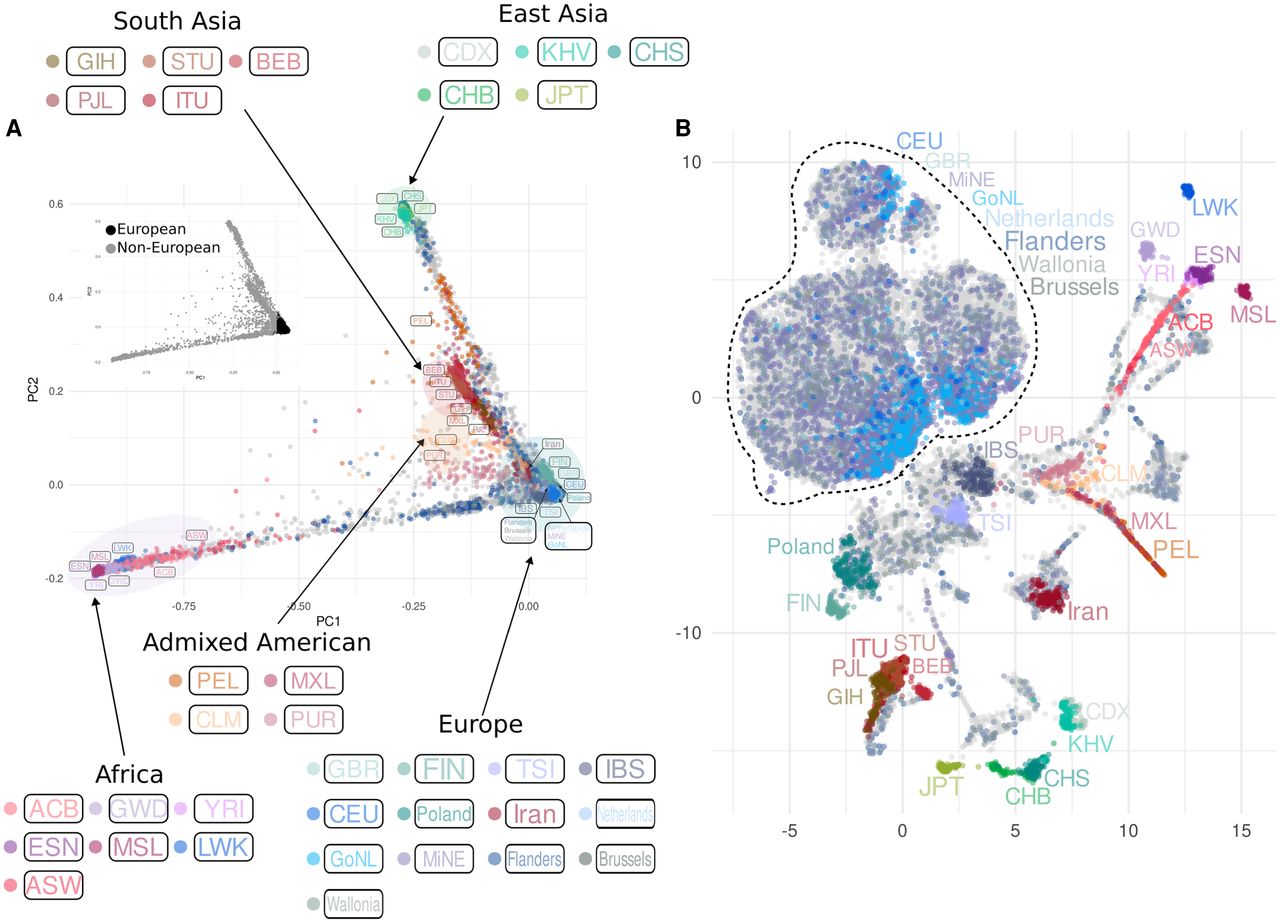
Principal component analysis of imputed NIPS data in the context of regional and global reference populations. (A) The plot of PC1 and PC2. The smaller PCA plot highlights European and non-European ancestries. (B) UMAP plot of the first 20 PCs. Both plots display the distribution of 27,354 imputed NIPS samples (gray dots in the background) together with samples from the 1000 Genomes Project, the GoNL, and the MinE data sets, after applying a GDI filter removing variants with low quality in more than 30% of the imputed NIPS samples. Population labels are displayed next to the group they represent (samples from Iran and Poland are part of the Belgian data), with colors of the labels matching the colors of the corresponding samples. Unlabeled imputed samples are depicted as gray dots in the background. The dotted line includes the group represented by samples from the GoNL, the MinE, the 1000 Genomes Project (CEU and GBR only), unlabeled NIPS samples, and NIPS individuals labeled as Flanders, Wallonia, Brussels, and the Netherlands.