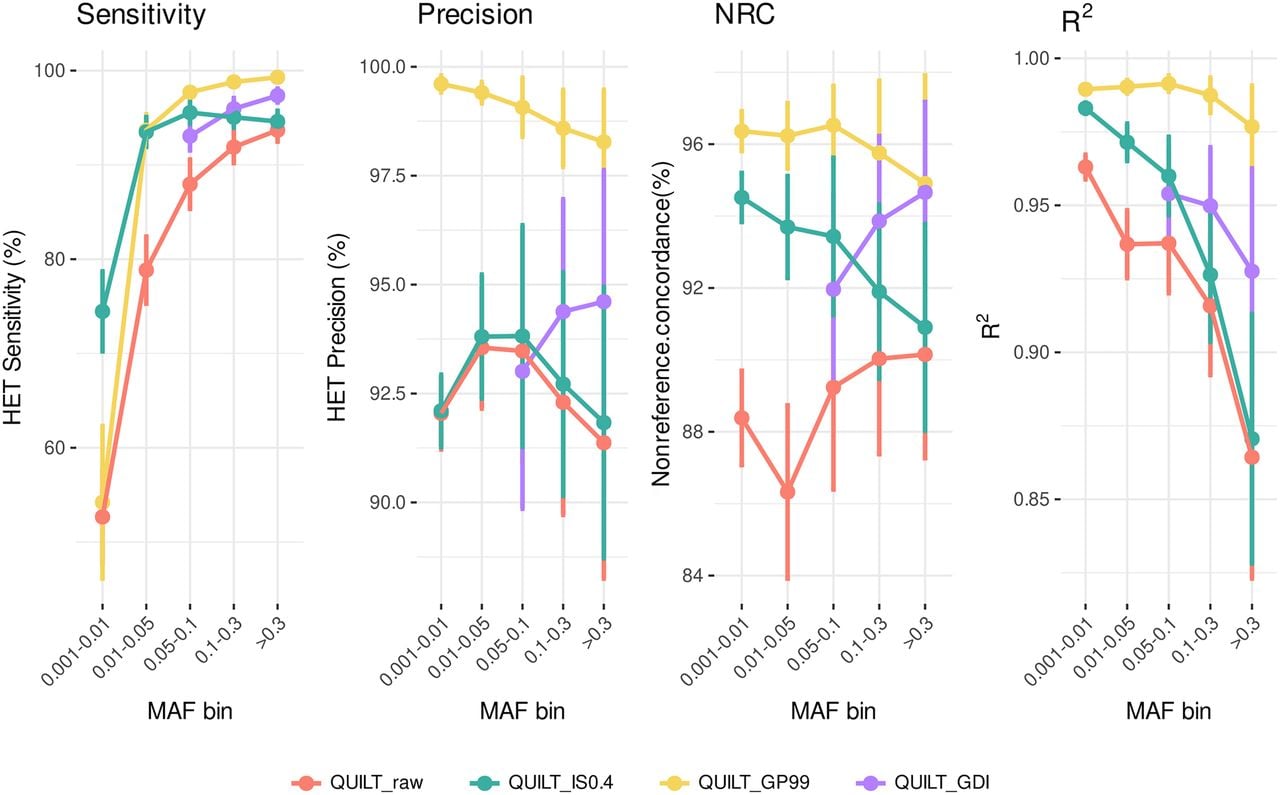
Comparative analysis of postimputation filters on QUILT performance by four measures of accuracy. Each panel displays results for different postimputation statistics for those genotypes imputed as heterozygous: Sensitivity (TP/[TP+FN]), Precision (TP/[TP+FP]), Nonreference concordance (NRC = 1−[Err + Era + Eaa]/[Err + Era + Eaa + Mra + Maa], where Err, Era, and Eaa are the counts of the mismatches for the homozygous reference, heterozygous and homozygous alternative genotypes, and Mra and Maa are the counts of the matches at the heterozygous and homozygous alternative genotypes, and the dosage r-squared (Pearson's r2 on dosage values calculated using BCFtools stats). Lines are colored based on different filtering approaches. Results are averaged across the three test samples, with SD bars showing the variability around the mean values (refer to Supplemental Table S2 for detailed information on the values). The lack of QUILT_GDI data points in the 0.001–0.01 and 0.01–0.05 frequency bins reflects our focus on common variants with MAF > 5% in the HRC panel.