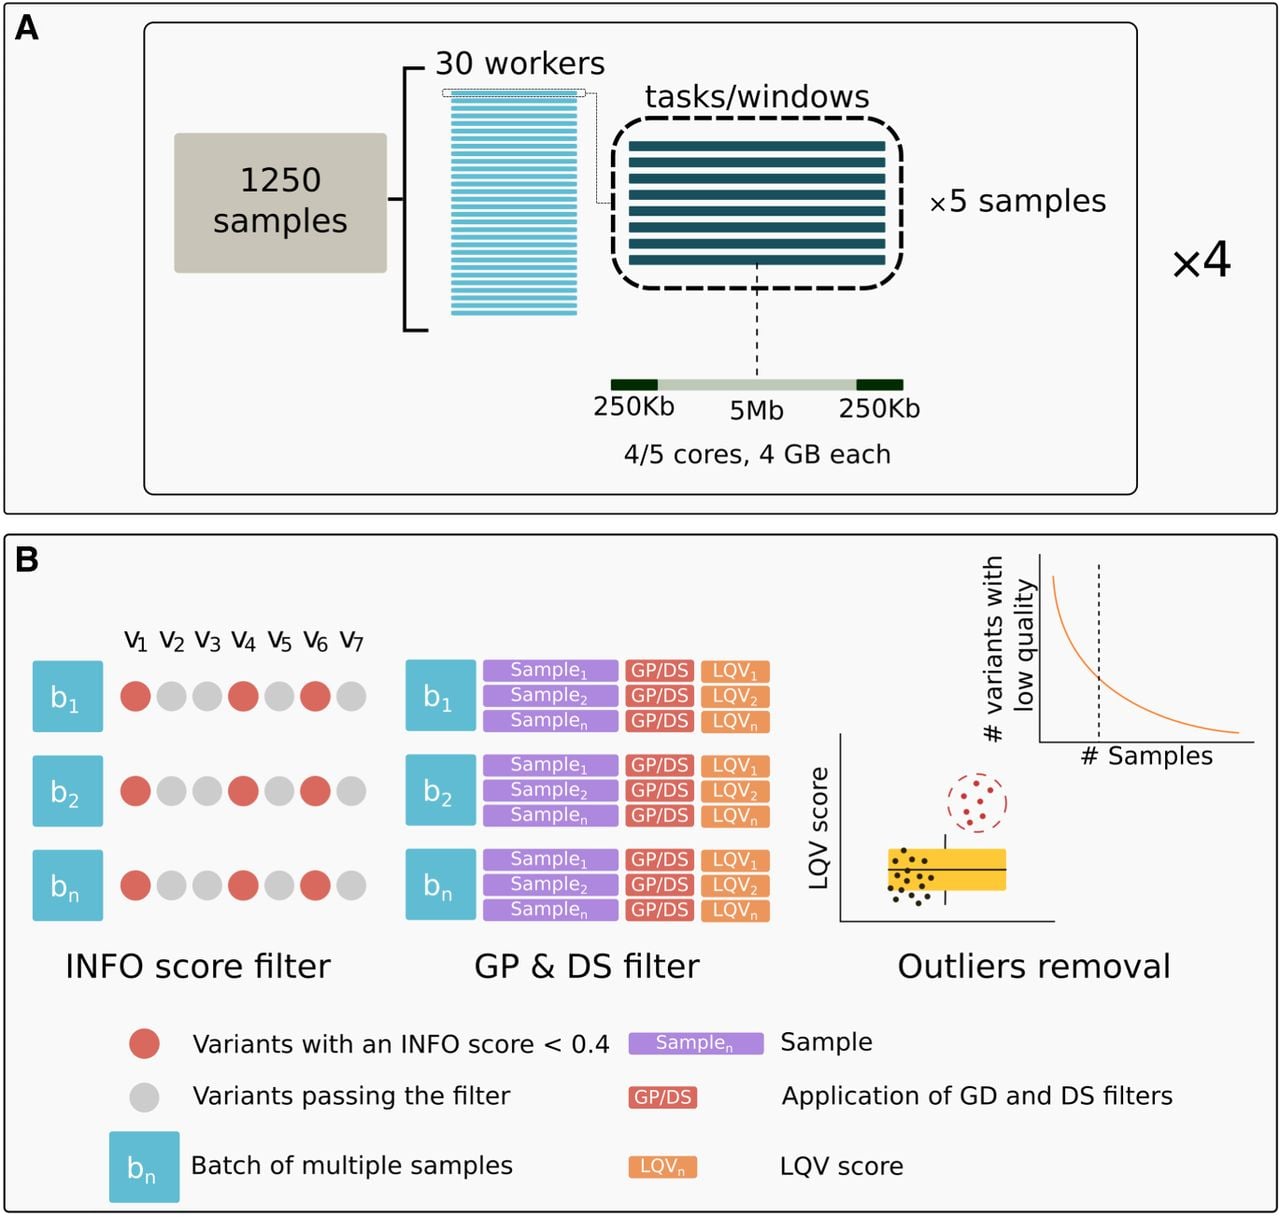
Imputation pipeline and filtering scheme used in this study. (A) Imputation pipeline with QUILT. The image illustrates the design of imputation of a batch of 1250 individuals, described in further detail in the Methods section. (B) GDI filtering scheme. INFO score filter: Each column (e.g., v1, v2, v3, etc.) represents a distinct variant, and each row (e.g., b1, b2, bn) corresponds to a batch. Variants with an INFO score <0.4 in all batches (red dots) are excluded from subsequent steps. This exclusion applies only when the same variant consistently displays this condition across all batches (e.g., three out of seven variants in the example cartoon are excluded). Variants that pass the filter (gray dots) proceed to the next step. GP & DS filter: Using the variants that passed the previous step, for each individual within a batch, an LQV score (low-quality variant score) is calculated, indicating the proportion of variants that do not meet both GP and DS thresholds. Each sample's LQV score is then used to assess the quality of the data. Outliers removal: The distribution of LQV scores is analyzed to identify and remove outlier samples (represented by the red dots in the box plot). For the remaining samples (represented by the black dots in the boxplot), the distribution of variants with low quality is assessed relative to the total number of samples. The curve in the top right subpanel illustrates how a cutoff is determined to exclude variants that consistently exhibit low quality in more than a specified percentage of samples. Visual inspection of UMAP plots was used to determine the optimal cutoff (additional details are provided in the main text).