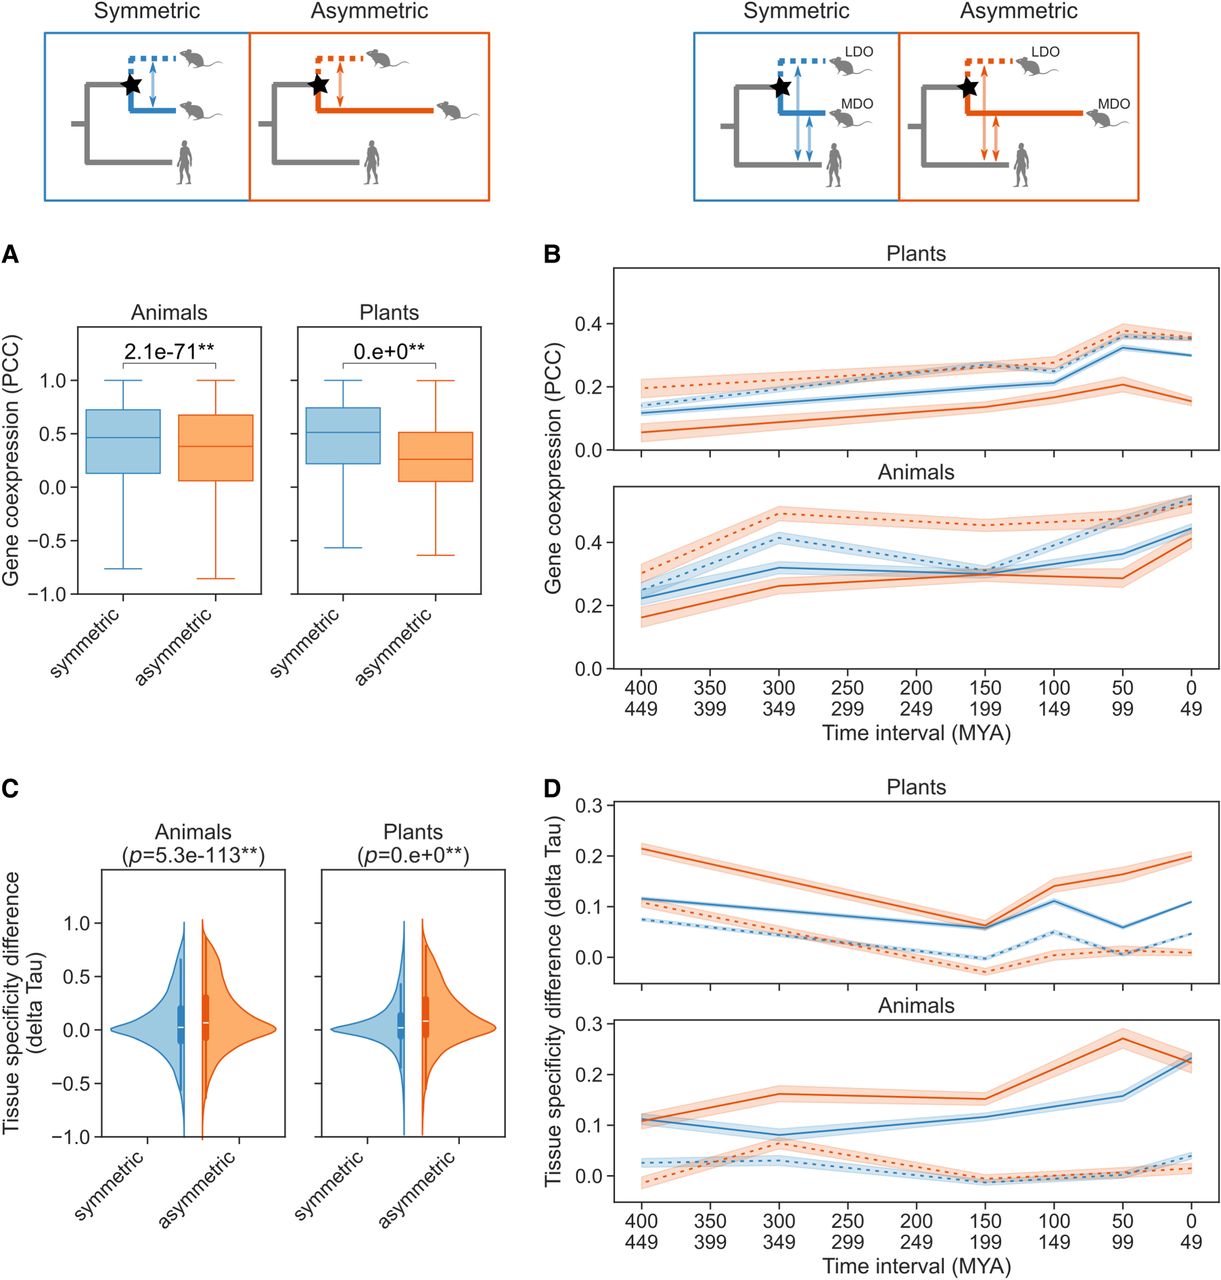
Functional analysis of paralogs using expression data. (A) Gene coexpression values of paralogs following symmetric (n = 275,988) and asymmetric (n = 31,671) duplications, calculated using the Pearson correlation coefficient (PCC). The P-values are indicated on top of the figures for the Mann–Whitney U test. (*) P < 0.05, (**) P < 0.01. (B) Gene coexpression (PCC) between the LDO (dashed lines) and MDO (solid lines) genes and their closest outgroup co-ortholog following symmetric (blue) and asymmetric (orange) duplications. The sample sizes for this plot are as follows: plants symmetric n = 114,702, plants asymmetric n = 13,533, animal symmetric n = 17,493, and animal asymmetric n = 7490. (C) Violin plot showing the tissue specificity differences (delta Tau) between the paralogs following symmetric (animals n = 77,889, plants n = 275,988) and asymmetric (animals n = 17,205, plants n = 31,671) duplications. (D) Tissue specificity differences (delta Tau) between the LDO (dashed lines) and MDO (solid lines) genes and their closest orthologs following symmetric (blue) and asymmetric (orange) duplications. The sample sizes are the same as in B. In plots B and D, the x-axis indicates the divergence time between the species compared in time intervals. Plant and animal data sets were compared independently. The comparisons used are shown above each panel, with duplication events marked by stars.