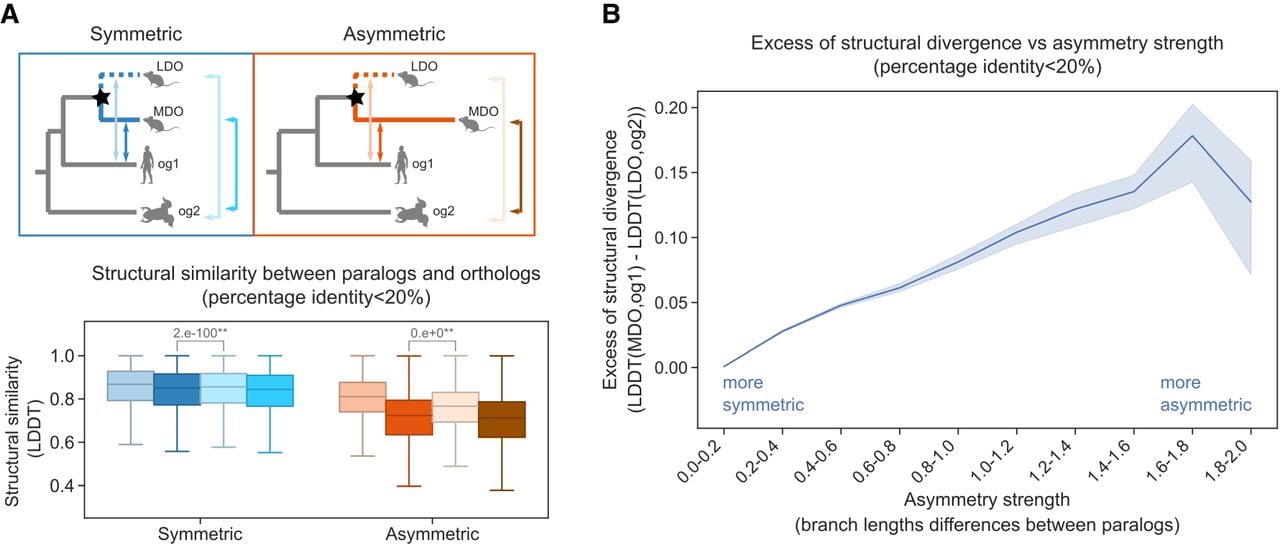
Figure 3.
Structural similarity between paralogs and orthologs. (A) Structural similarity of each paralog to two different orthologs (og1 and og2) (n = 466,476). Stars on the tree nodes indicate duplication events. Box colors correspond to the arrows in the figure, indicating the comparisons made. The P-value is indicated on top of the figure for the Mann–Whitney U test (**) P < 0.01. All comparisons and P-values are indicated in Supplemental Table S4. (B) Comparison of the excess of structural divergence and the asymmetry strength (n = 466,476). The shaded area represents the 95% confidence interval around the mean. The x-axis represents increasing bins of asymmetry strength.