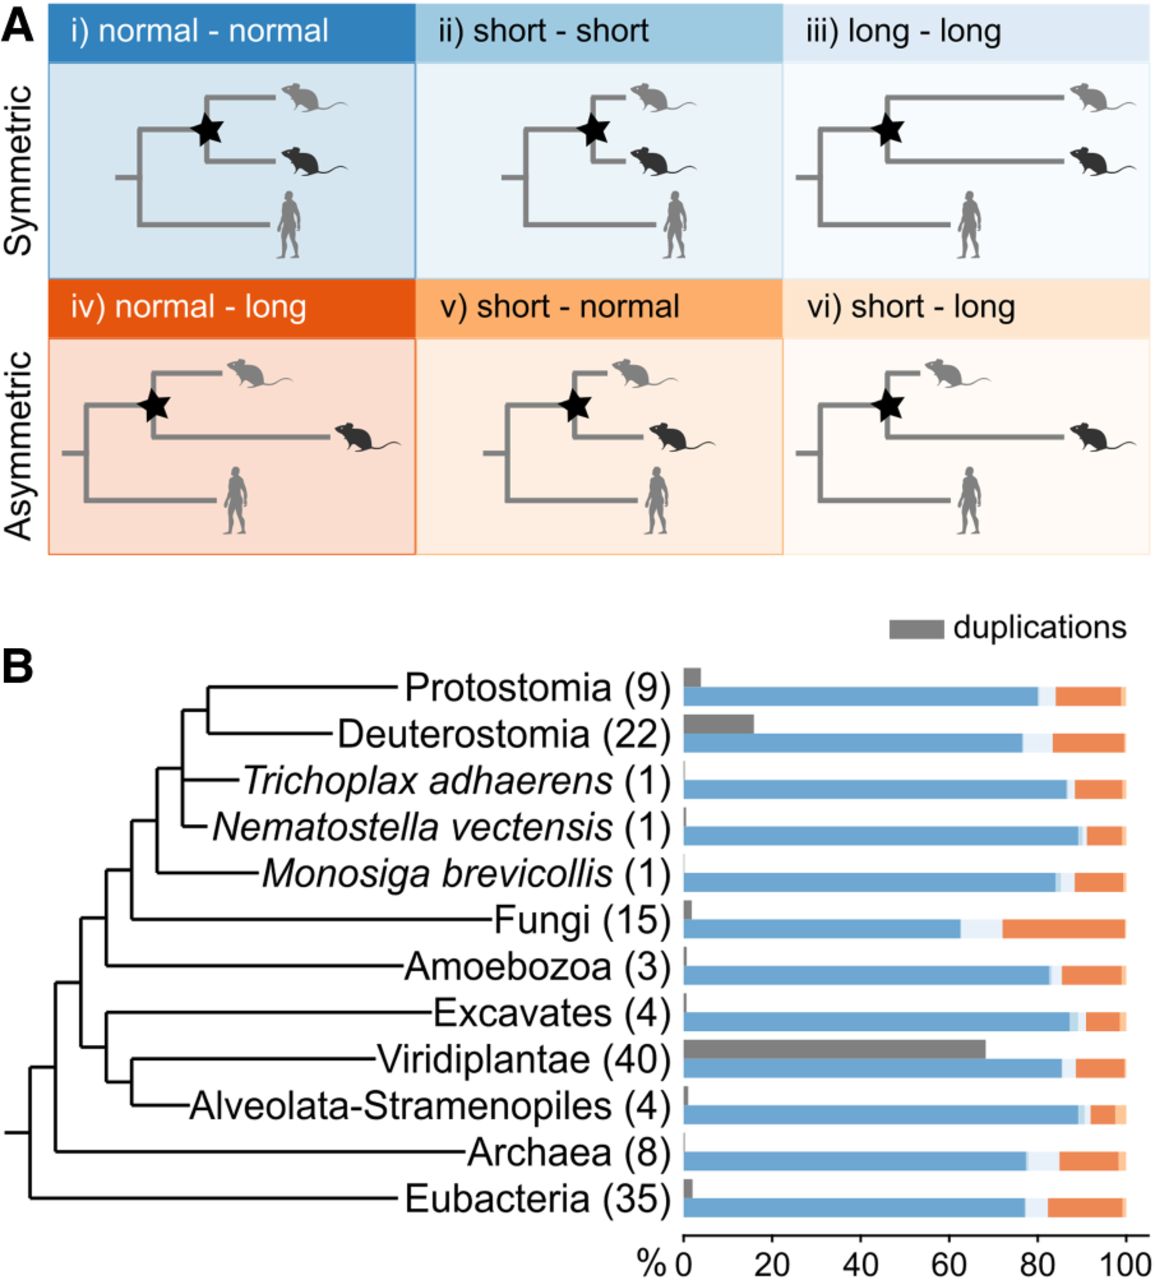
Branch length analysis following duplication events. (A) Depiction of the six categories indicating differences in branch length following a duplication event (node marked with a star). The two rows divide the symmetric and asymmetric evolution of paralogs following duplication. The light silhouette (gray mouse) indicates the least diverged ortholog (LDO), and the dark silhouette (black mouse) indicates the most diverged ortholog (MDO). (B) Species tree showing the major lineages analyzed. The numbers in parentheses indicate the number of species included from the lineage. Gray bars represent the percentage of total duplications contributed by each lineage. Colored bars indicate the proportion of duplications within each category (color scheme as in A), relative to the total number of duplications in that lineage. The absolute numbers of duplications are provided in Supplemental Table S3.