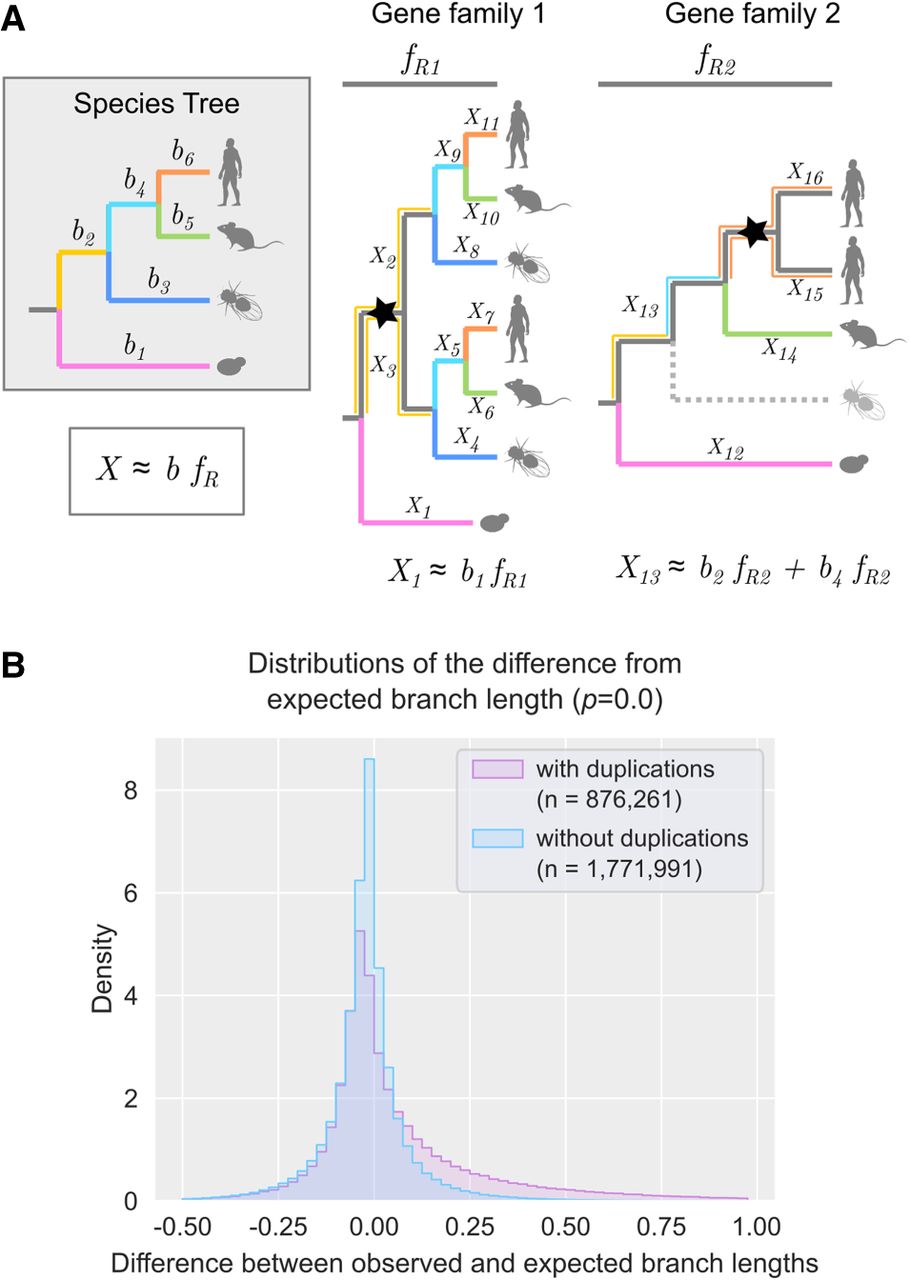
Analysis and calculation of expected gene tree branch lengths. (A) Graphical illustration of the calculation of the expected branch lengths (X). On the left, a species tree depicts the phylogenetic relationships of four species with branches highlighted by different colors and branch numbers (b1 to b6). On the right, two gene trees show a duplication event (node marked with a star). The first gene tree is complete, and the second tree has a gene loss represented by a dashed line. fR denotes the family-specific rate. When no losses occur (Gene family 1), there is an exact correspondence between the speciation branch in the gene tree and the species tree (X1 to X11). When there is a loss (Gene family 2), the speciation branch in the gene tree represents the sum of the corresponding branches in the species tree (X13). Note that in both gene families, when a duplication occurs, all paralogous branches are calculated, and the expected values remain the same. (B) Distributions of the differences from expected branch lengths in branches with duplications (pink) and without duplications (light blue). The sample size (n) is indicated in the figure. The P-value for the Mann–Whitney U test is shown between parentheses (P = 0.0).