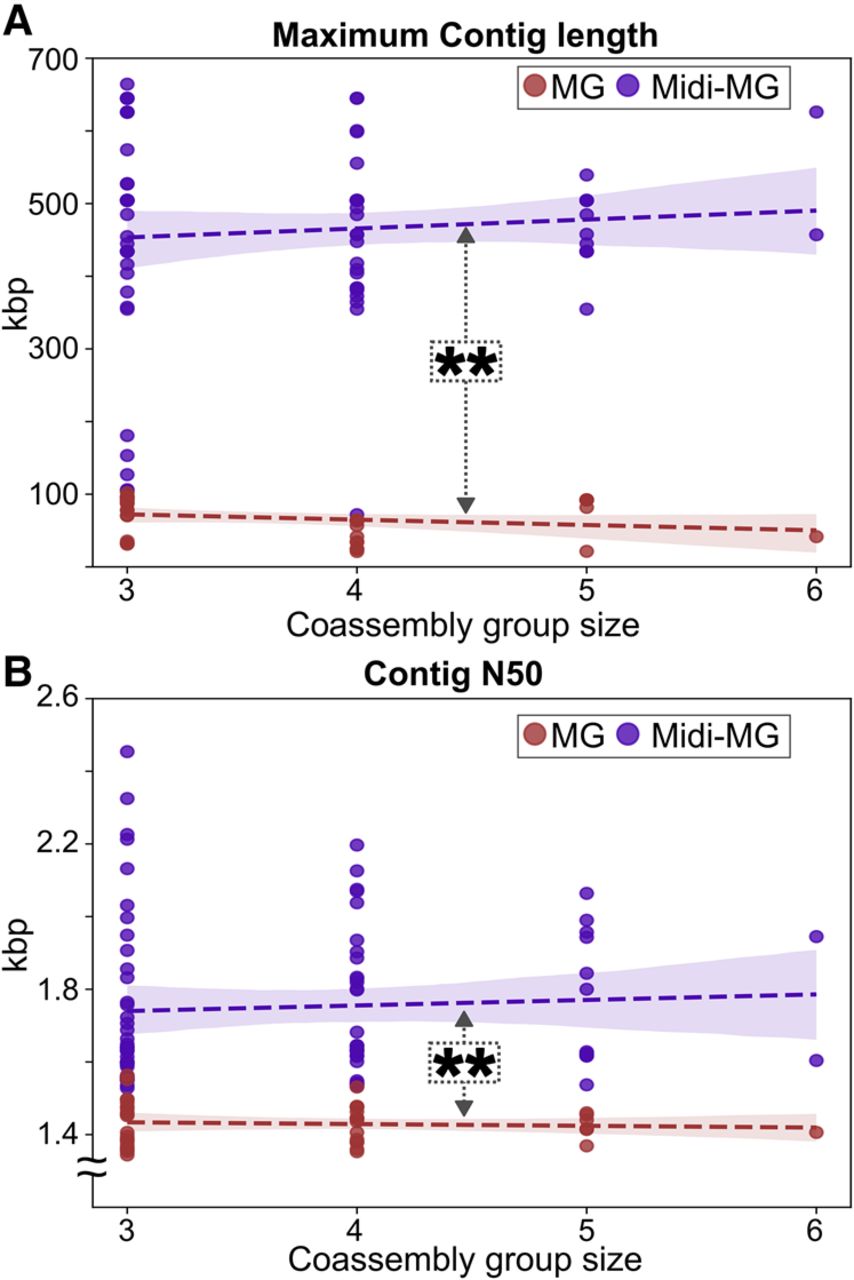
Figure 4.
Comparison of assembly metrics for metagenomic and midi-metagenomic approaches in dependance on coassembled samples and fractions. Scatterplots showing metagenomic results as red, and midi-metagenomic results as purple dots. Trendlines and corresponding confidence areas were determined by regression analysis and are indicated by dashed lines and background coloring, respectively. (A) Maximum contig lengths. (B) Contig N50 values. The significance of differences in the distribution between metagenomic and midi-metagenomic assembly metrics were determined via Mann–Whitney U tests (MacFarland and Yates 2016). (MG) Metagenome, (Midi-MG) midi-metagenome.