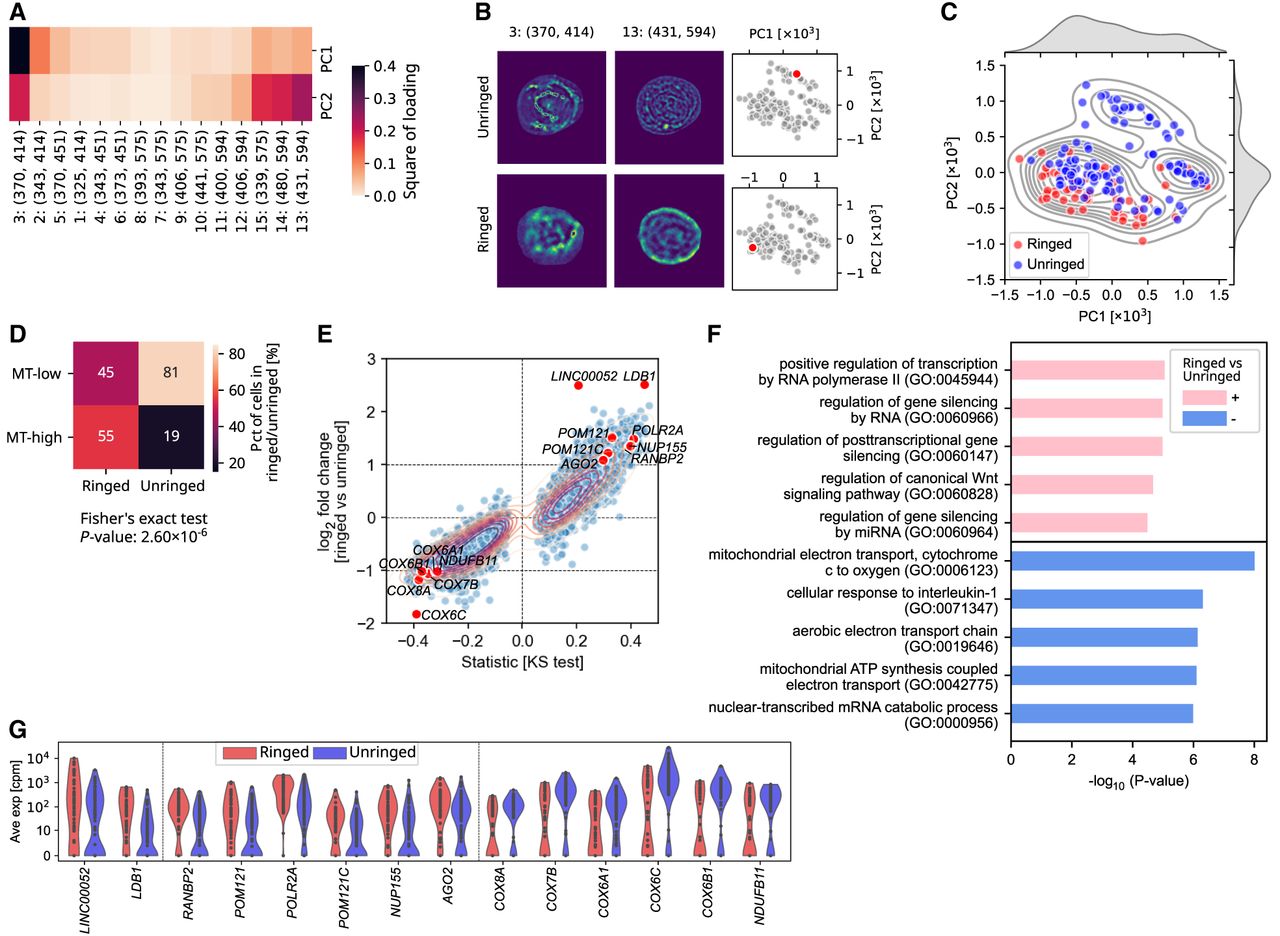
Optical cell heterogeneity can be used as a guide to query transcriptional heterogeneity. (A) The square of loading of every channel to PC1 and PC2 generated from PCA on average autofluorescent intensities under 15 channels of all cells. (B) Examples of segmented cells without (upper panel) and with (lower panel) bright rings in channel 13 (λex = 431 nm, λem = 594 nm). The location of example cells in the PC1-PC2 map are shown in two right panels. (C) Scatter- and KDE plots of PC1 and PC2 of each cell. Red and blue face colors indicate cells with (ringed) and without (unringed) rings. (D) Heat map showing the percentage of ringed and unringed cells that are MT-low or MT-high. (E) Scatterplot of the log2 fold change between ringed and unringed cells (y-axis) and signed statistics from KS test (x-axis). Genes with median number in either subgroup as 0 were filtered out. (F) The top five Gene Ontology (GO) terms among genes upregulated or downregulated in ringed cells relative to unringed cells. Upregulated genes indicate genes with log2 fold change > 1 and −log10(P-value) > 2, and downregulated genes indicate genes with log2 fold change < −1 and −log10(P-value) > 2. Genes with median number in either subgroup as 0 were filtered out, and P-values were corrected by the Benjamini–Hochberg (nonnegative) method. (G) Violin plot showing the expression of some genes up- or downregulated in ringed cells.