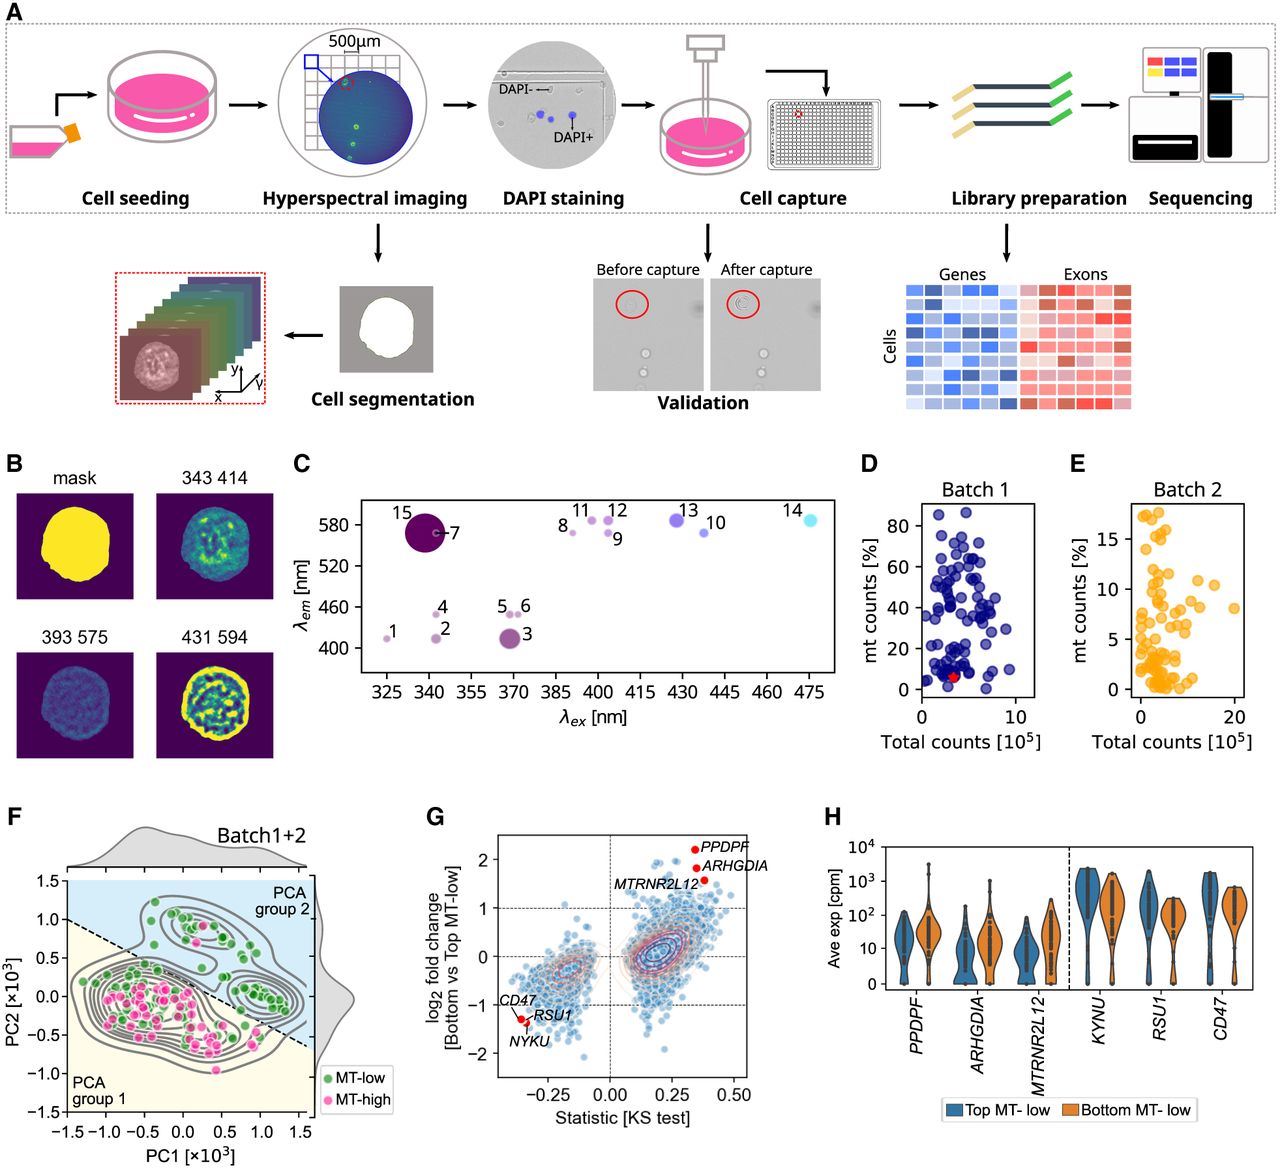
SpectralSeq integrates hyperspectral imaging and transcriptomics from the same cell. (A) Schematic of SpectralSeq's experimental and computational workflow. (B) Segmentation mask and select autofluorescence channels for a representative cell. (C) Autofluorescence spectrum for the same cell as in B. Each dot indicates a channel with the channel number labeled (Supplemental Table S1). Dot size indicates fluorescence intensity detected in each channel and dot color is a left-right gradient corresponding to excitation wavelength. All pixels within the segmentation mask were averaged. (D) Total reads per cell versus percentage of mitochondrial over total reads for experimental batch 1, with the same cell as in B highlighted as a red star. (E) As in D but for experimental batch 2. (F) Hyperspectral PCA for both batches combined, highlighting two groups of cells: PCA group 1 (yellow background) and PCA group 2 (blue background). (G) Scatterplot of the log2 fold change between MT-low cells in PCA groups 1 and 2 (y-axis) and signed statistics from KS test (x-axis). Genes with median number in either subgroup as 0 were filtered out. Some genes that are lower or higher expressed in bottom MT-low cells are labeled. (H) Violin plot showing the expression of highlighted genes in G in top and bottom MT-low cells.