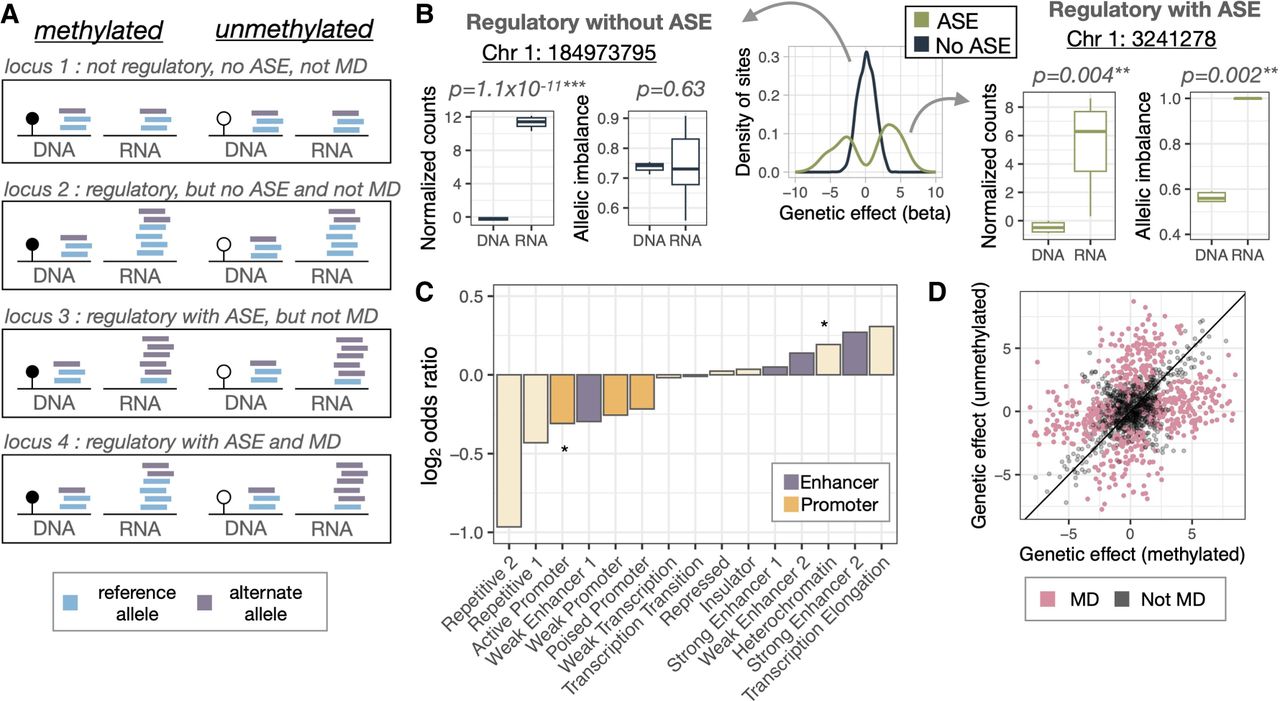
Multiplexed mSTARR-seq identifies allele-specific regulatory activity that is modulated by methylation. (A) Patterns of read pileups associated with the identification of regulatory activity, ASE, and MD ASE. Reference alleles are indicated in blue; alternate alleles, in purple. (B) Density of tested sites with ASE versus without ASE in the unmethylated condition, with an example plot of each showing the regulatory activity (normalized DNA and RNA counts) and ASE (the ratio of reference allele to total counts, i.e., allelic imbalance) present in each replicate. (C) Fisher's exact test for enrichment in ChromHMM genomic annotations comparing ASE sites (combined across conditions) versus non-ASE sites. Bars above y = 0 indicate annotations that are overenriched in ASE sites, and bars below y = 0 indicate annotations that are underenriched in ASE sites; purple bars indicate enhancer annotations; orange bars indicate promoter annotations; and stars indicate significant (P < 0.05) over/underenrichment of that annotation type (for full results, see Supplemental Table S9). (D) The genetic effect in the methylated condition plotted against the genetic effect in unmethylated condition for ASE sites, with the 575 MD ASE sites highlighted in pink.