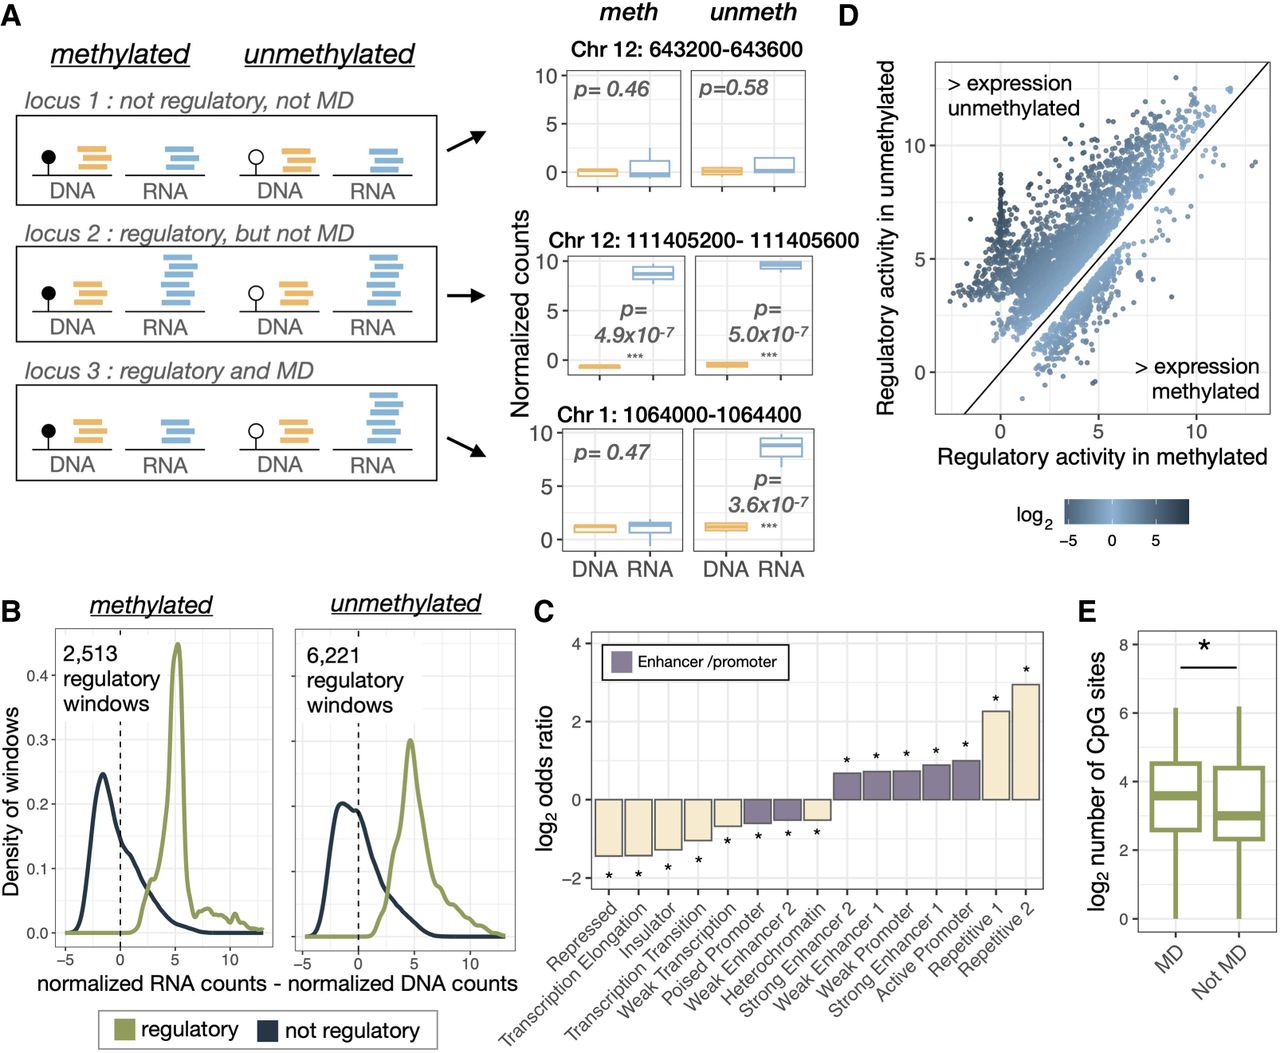
Multiplexed mSTARR-seq identifies regulatory and methylation-dependent (MD) regulatory activity. (A) Heuristic patterns of read pileups associated with the identification of regulatory activity and methylation dependence, with an example of the normalized read counts for a window falling into each of these categories. (B) Density of regulatory and nonregulatory windows (area under each curve normalized to one) in relation to the difference between normalized RNA and DNA counts for that window. (C) Fisher's exact test for enrichment in ChromHMM genomic annotations when comparing windows with regulatory activity (combined across conditions) versus nonregulatory windows. Bars above y = 0 indicate annotations that are overenriched in regulatory windows, and bars below y = 0 indicate annotations that are under enriched in regulatory windows; purple bars indicate enhancer and promoter annotations; and stars indicate significant over/underenrichment of that annotation type (for full results, see Supplemental Table S6). (D) Regulatory activity in the methylated versus unmethylated condition for MD windows colored by the logFC between conditions: 84.8% of MD windows have greater activity in the unmethylated condition, with the clustering of sites at x = 0 representing windows whose expression is entirely repressed by methylation. (E) Windows with MD regulatory activity have a greater number of CpG sites compared with regulatory windows that are not modulated by methylation.