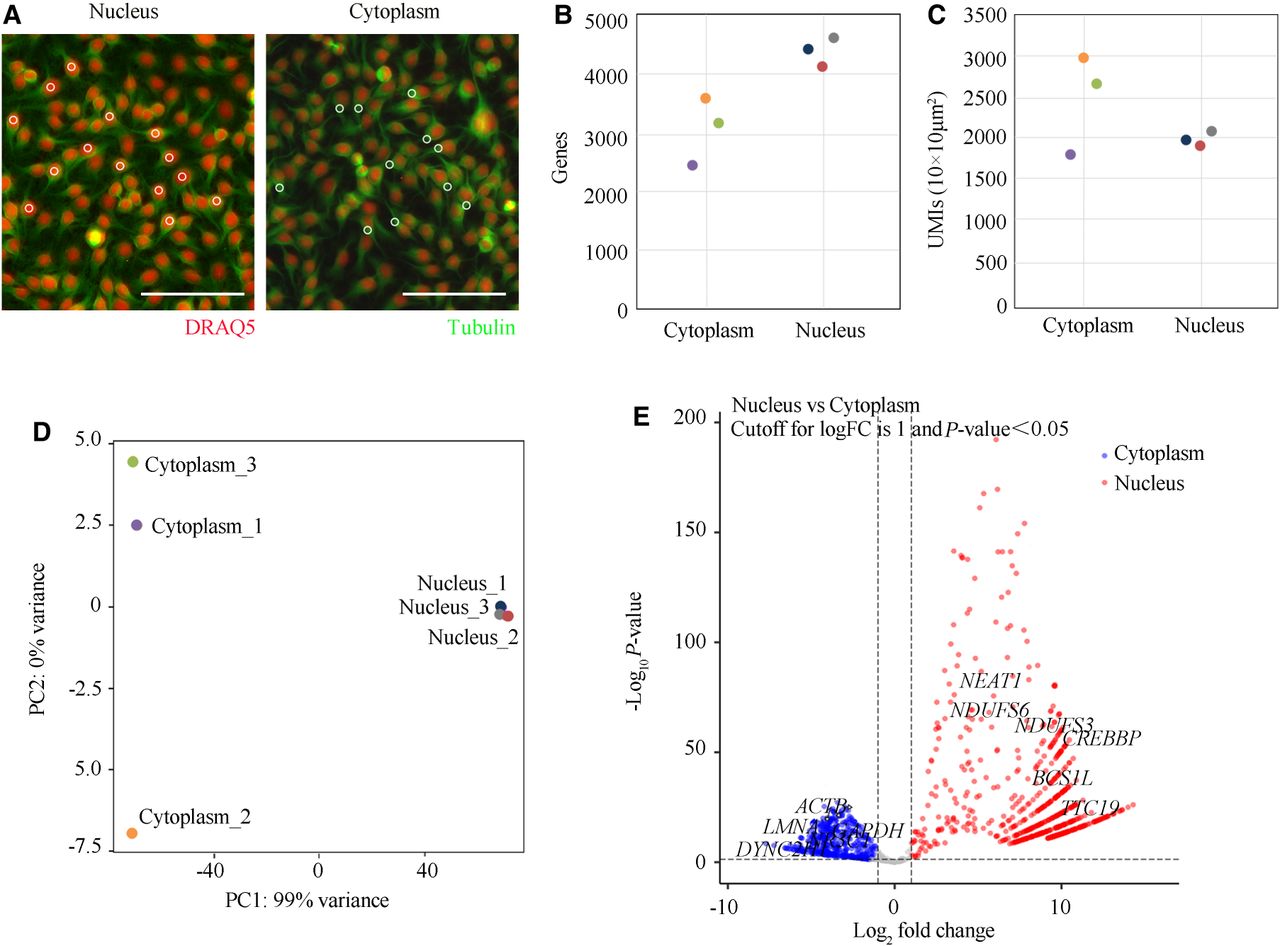
PCL-seq for subcellular gene expression analysis. (A) Immunofluorescence staining of HeLa cells, with the cytoplasm labeled using Alexa Fluor 488-conjugated anti-tubulin antibody (green) and the nucleus stained with DRAQ5 dye (red). Tubulin-positive and DRAQ5-positive regions were selectively photoilluminated to distinguish subcellular areas. Scale bar, 100 µm. (B,C) The number of detected genes (B) and uniquely mapped UMIs per 100 µm² (C) are shown. (D) PCA visualizing the two-dimensional expression profiles of subcellular regions. (E) Volcano plot illustrating differentially expressed genes between nuclear and cytoplasmic compartments (|log2FC| > 1, P < 0.05). A total of 647 genes were significantly upregulated (red) and 421 genes downregulated (blue). Axes: x, log2(fold change); y, −log10(P value). Selected marker genes with significant differential expression are highlighted.