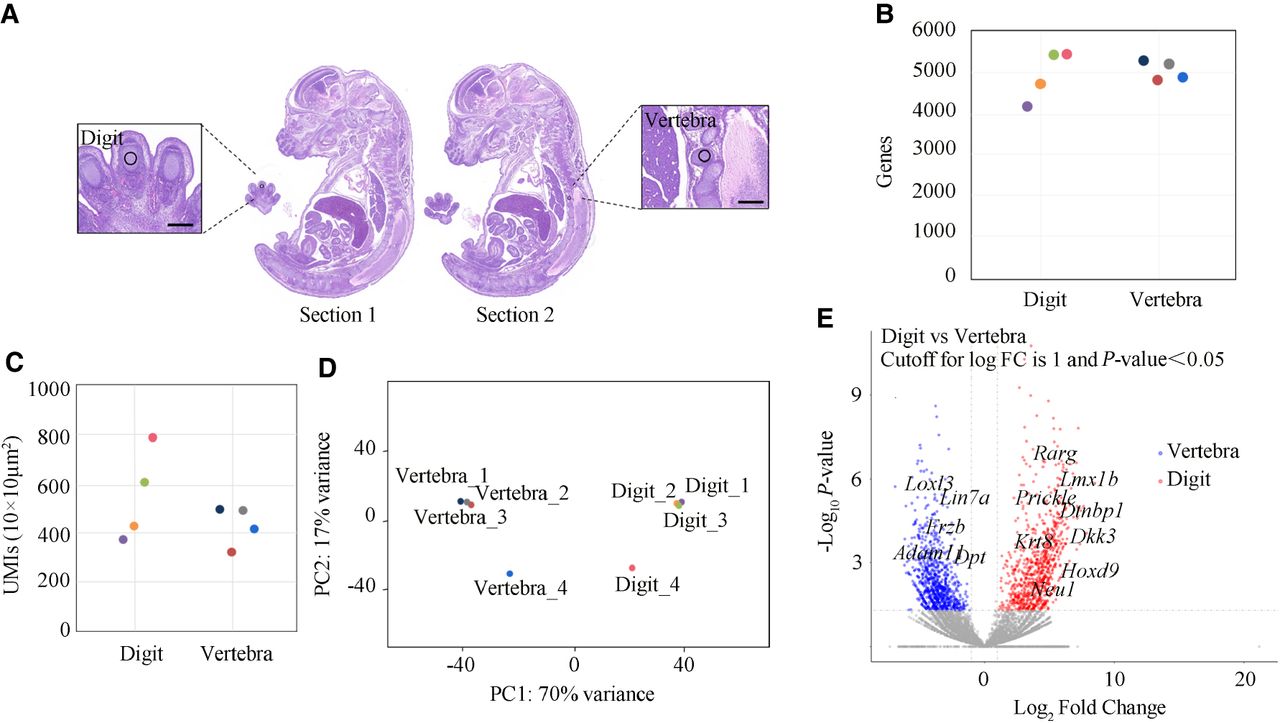
PCL-seq analysis of FFPE mouse embryo sections. (A) Hematoxylin and eosin (H&E) staining was performed on adjacent mouse embryo sections to highlight distinct ROIs. The digit and vertebra regions were selectively photoilluminated to define specific areas for analysis. Each illuminated region was circular, with a diameter of 100 µm. Scale bar, 250 µm. (B) The number of identified genes in each region is shown. (C) The number of UMIs detected per 100 µm² is shown. (D) PCA illustrates the separation of expression profiles between digit and vertebra ROIs in two dimensions. (E) Volcano plot illustrating differentially expressed genes between digit and vertebra regions (|log2FC| > 1, P < 0.05). A total of 849 genes were significantly upregulated (red) and 868 genes downregulated (blue). Axes: x, log2(fold change); y, −log10(P value). Selected marker genes with significant differential expression are highlighted.