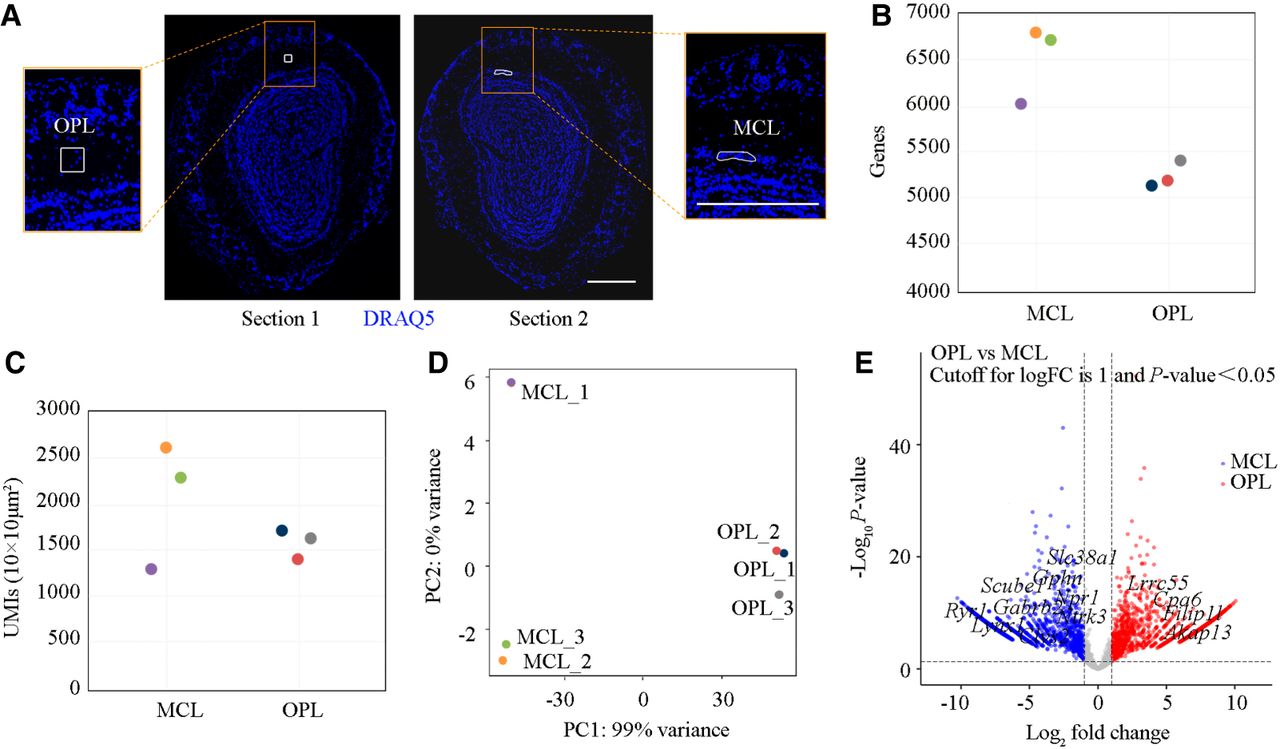
Analysis of PCL-seq for ROI-specific profiling in the fresh-frozen mouse olfactory bulb. (A) Two specific regions, the mitral cell layer (MCL) and outer plexiform layer (OPL), were selected from adjacent slices. The blue signal indicates pseudocolor derived from DRAQ5 staining. Scale bar, 500 µm. (B) The number of detected genes in each ROI is shown. (C) The number of UMIs per 100 µm² is shown for each ROI. (D) Principal component analysis (PCA) illustrates the distribution of samples based on expression profiles in two dimensions. (E) Volcano plot illustrating differentially expressed genes between OPL and MCL regions (|log2FC| > 1, P < 0.05). A total of 1237 genes were significantly upregulated (red) and 1567 genes downregulated (blue). Axes: x, log2(fold change); y, −log10(P value). Selected marker genes with significant differential expression are highlighted.