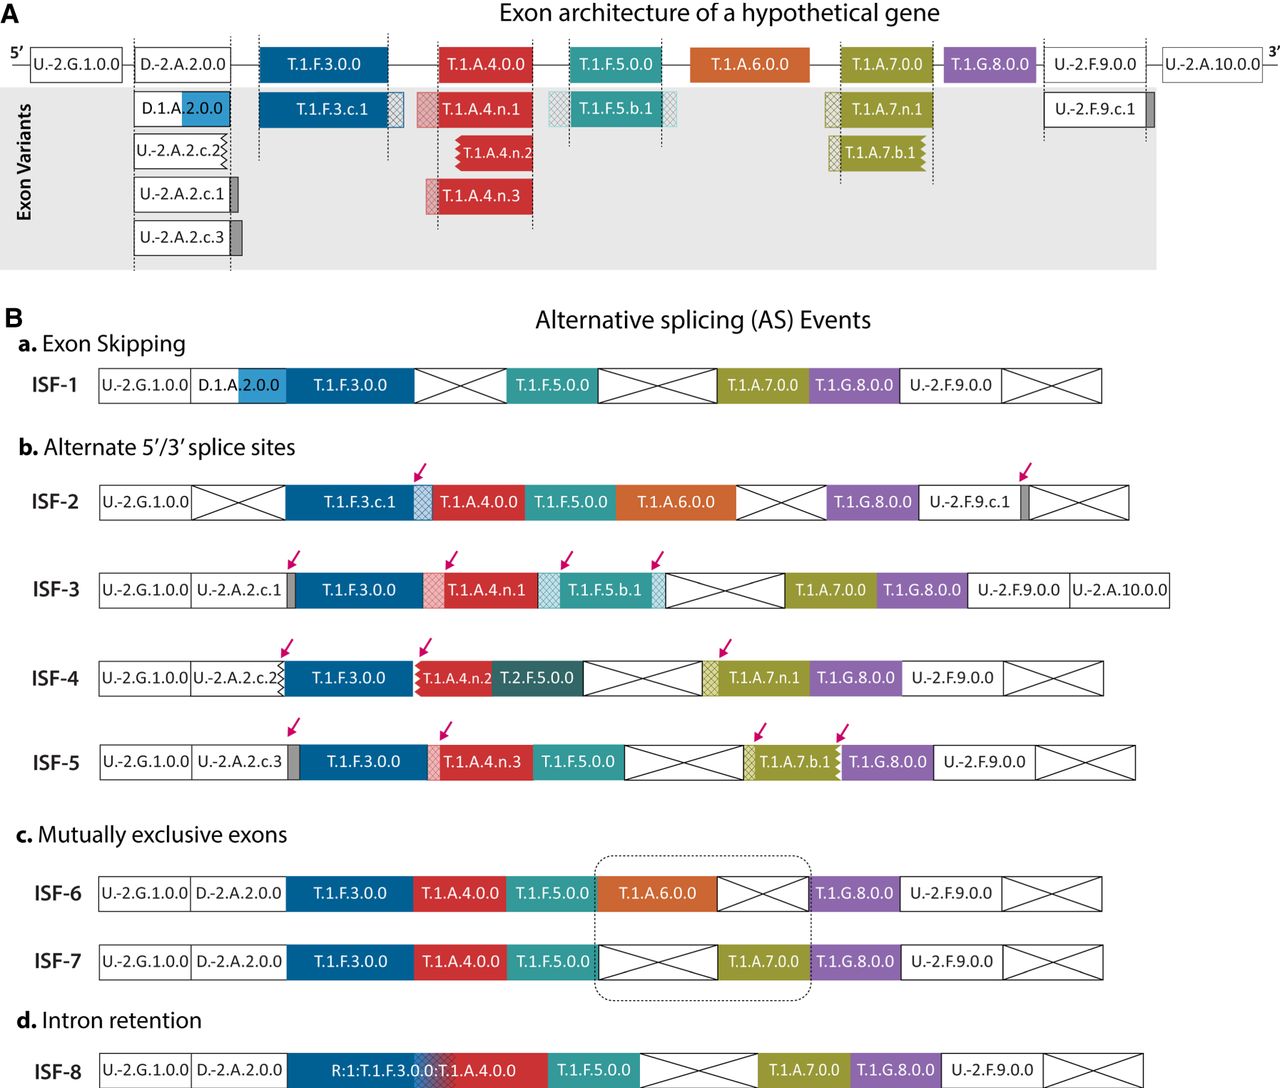
Schematic illustrating events involving alternative splicing (AS), alternative transcription (ATR), and alternative translation (ATL). Figure represents a hypothetical example of various AS, ATR, and ATL splicing events. (A) Topmost row represents the reference exons (RSOEx; see Methods), arranged in the 5′-to-3′ direction. Gray region depicts the splice-site and amino acid sequence variants related to respective RSOEx from equivalent positions. (B) Inference of AS, ATR, and ATL events is facilitated by their inter-transcript comparison. ATR and ATL events involve a change in UTR and CDS, in which ATR events are inferred from alternate first or last exons and ATL events are inferred from alternate first or last coding exons or variations in Block-I local scope within exon for different isoforms. AS events involving ES and A(ss) are depicted based on their Block-II and Block-III attributes. Red arrows highlight splice-site variations for Block-III changes. ISF-6 and ISF-7 show a MXE event involving exon 6 and exon 7 in dashed round rectangles, and ISF-8 shows an IR event from gradation of two exon colors (exon 3 and exon 4). Exons are represented as rectangular boxes with a unique identifier (EUID) assigned to them within transcripts. Variability in Block-I features of an exon is shown through variable colors. Noncoding exons are shown in white, and coding exons are filled in various colors to make a distinction from each other. Variations in splice sites are represented by crosshatched filled rectangles (for extension) and jagged ends (for shortening). The skipped exon is shown with a crossed empty rectangle box.