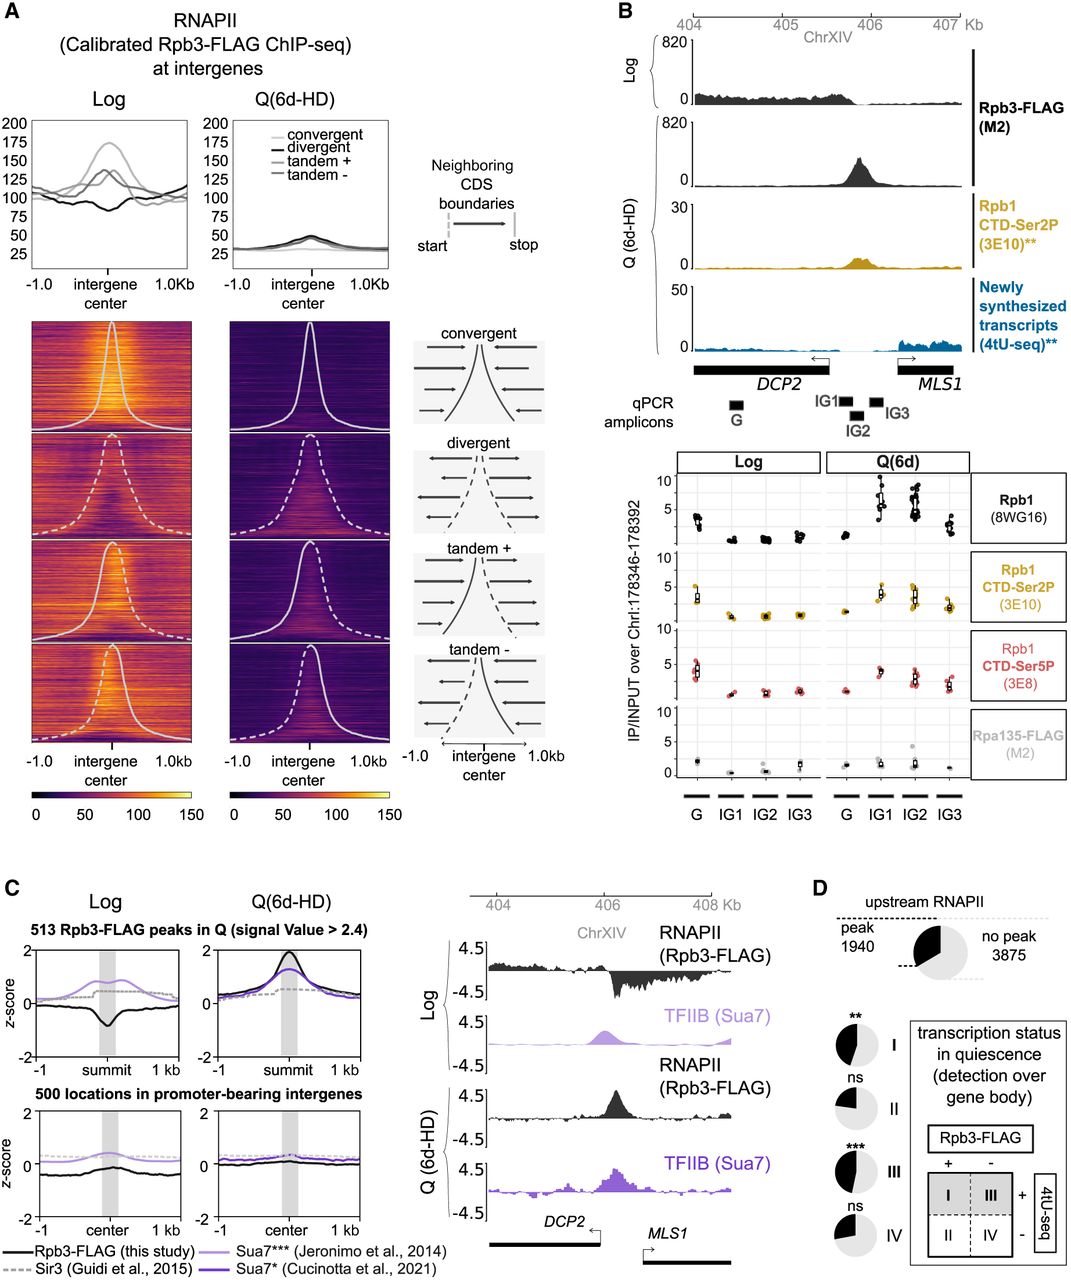
RNAPII redistributes to a subset of promoter-bearing intergenes when cells enter quiescence. (A) Rpb3-FLAG spike-in calibrated signal piled-up at the center of intergenes classified based on the orientation of surrounding coding annotations. Rows are sorted based on intergene size. (B) Mapping of RNAPII ([Rpb1 CTD] Rpb1 C-terminal domain, [Rpb1 CTD-Ser2P] Rpb1 CTD Serine 2 phosphorylation, [Rpb1 CTD Ser5P] Rpb1 CTD Serine 5 phosphorylation) and RNAPI (Rpa135-FLAG) epitopes in and around the RNAPII (Rpb3-FLAG) quiescent peak at the divergent intergene between DCP2 and MLS1 (class III genes). (Top) Genome Browser view of spike-in calibrated Rpb3-FLAG (this study), Rpb1 CTD-Ser2P (Swygert et al. 2019), and recently synthesized transcripts (4tU-seq, both strands merged) (Cucinotta et al. 2021). (Bottom) ChIP-qPCR IP/INPUT signal normalized to an intergenic region in Chr I (Methods). Antibodies used are written in parentheses. (C) Average profile plot of ChIP-seq or ChIP-array mappings (z-scores) of various nuclear proteins in exponential growth (Log) and quiescent (Q 6d-HD) cells: RNAPII (Rpb3-FLAG; this study), TFIIB (Sua7 in Log [Jeronimo and Robert 2014] Sua7 in quiescent [6d-HD] cells [Cucinotta et al. 2021]), and Sir3 (Guidi et al. 2015). Signals are centered at the summits of RNAPII (Rpb3-FLAG) strongest peaks in quiescence (MACS2 signal value > 2.4), falling in promoter-bearing intergenes, or at random locations in promoter-bearing intergenes without RNAPII peak overlap. (Right) Coverage tracks of samples shown in left panel at the DCP2/MLS1 intergene. (D) Pie charts depicting the proportion of genes bearing a RNAPII summit in the vicinity of their promoter, stratified by transcription status in quiescence, as described in Figure 3A. P-values for hypergeometric test: (**) 2.23 × 10⁻³, (***) 1.23 × 10−43.