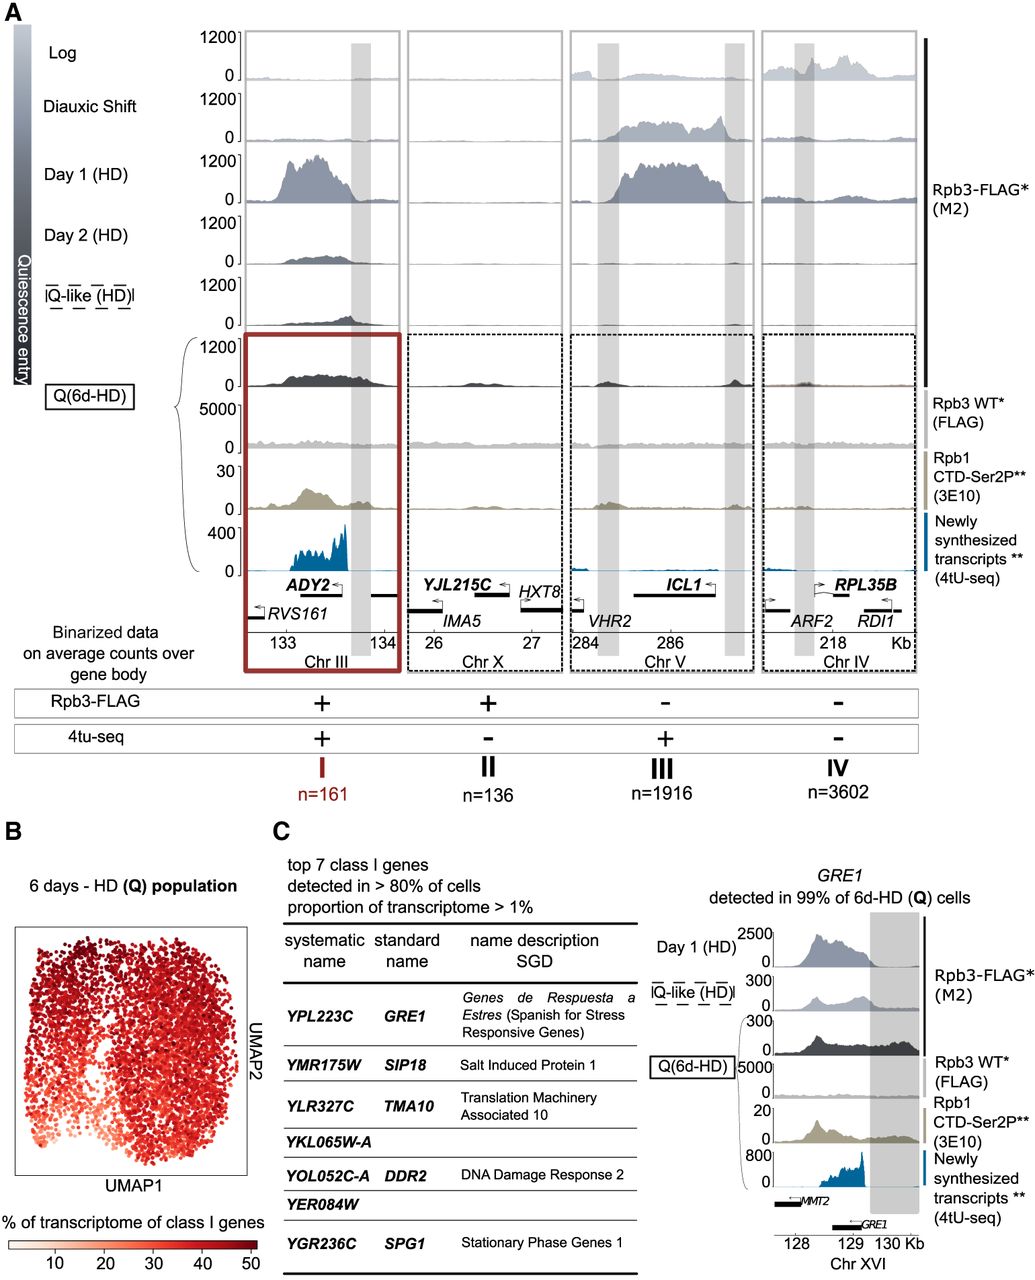
Transcriptional output is scant, but homogeneous, in the quiescent population. (A) Representative Genome Browser views of genes classified according to binarized Rpb3-FLAG binding and recently synthesized transcripts detection within the coding region. Thresholds are set at 50 average counts for Rpb3-FLAG and one average count for 4tU-seq (see Supplemental Fig. 3C,D,F). (*) This study, (**) Rpb1 CTD-Ser2P. Recently synthesized transcripts mappings are from the Tsukiyama laboratory (Swygert et al. 2019, Cucinotta et al. 2021). (B) UMAP representation of cells in the quiescent population assessed by scRNA-seq. Color scale represents the percentage of the transcriptome per cell for the sum of class I genes. (C, left) List of top seven class I genes, representing 18.8% of the transcriptome of the average cell. (Right) Genome Browser view of GRE1, detected in >99% of 6d-HD (Q) cells, during early respiration (day 1 HD) and in two types of quiescence induction: (Q-like) abrupt starvation from post-DS; (Q) nutrient exhaustion after 6 days. (*) This study, (**) Rpb1 CTD-Ser2P. Recently synthesized transcripts mappings are from the Tsukiyama laboratory (Swygert et al. 2019, Cucinotta et al. 2021). Intergenic accumulation of Rpb3-FLAG upstream of genes in Q samples (6d-HD) is highlighted in gray to allow comparison across conditions.