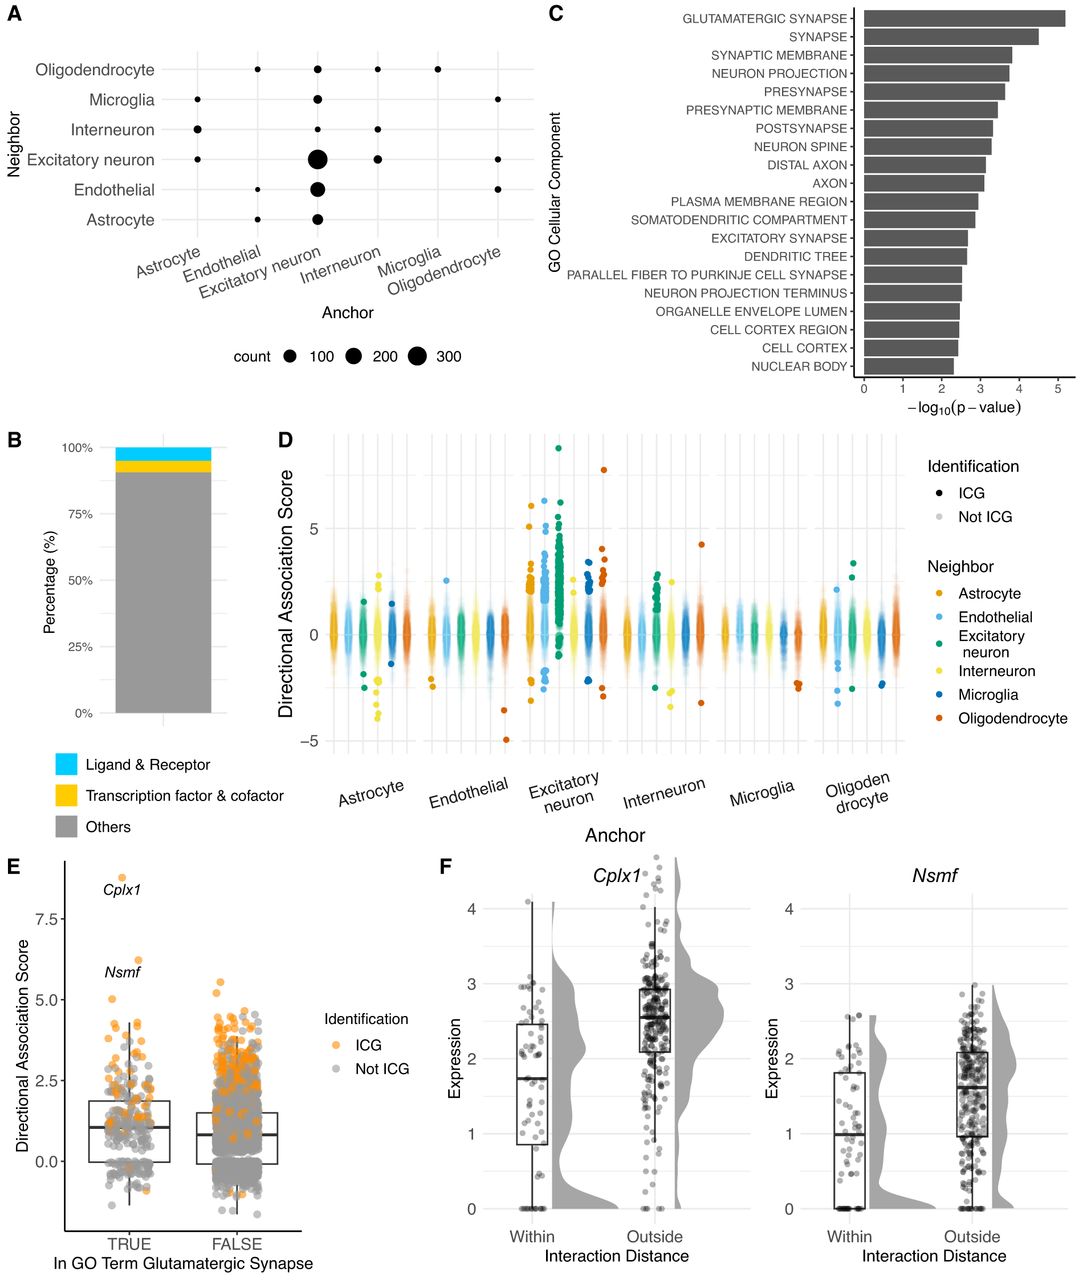
Figure 4.
Application of QuadST to a seqFISH+ data set from mouse cortex. (A) Number of significant ICGs by anchor–neighbor cell-type pairs. (B) Functional categories of significant ICGs. (C) GO cellular component enrichment of ICGs in interactions among excitatory neurons. (D) Directional association scores of ICGs and all other genes among all anchor–neighbor cell pairs. (E) Box plot of directional association scores of genes in and out of the glutamatergic synapse gene set. (F) Distance-expression profiles of the top two ICGs.