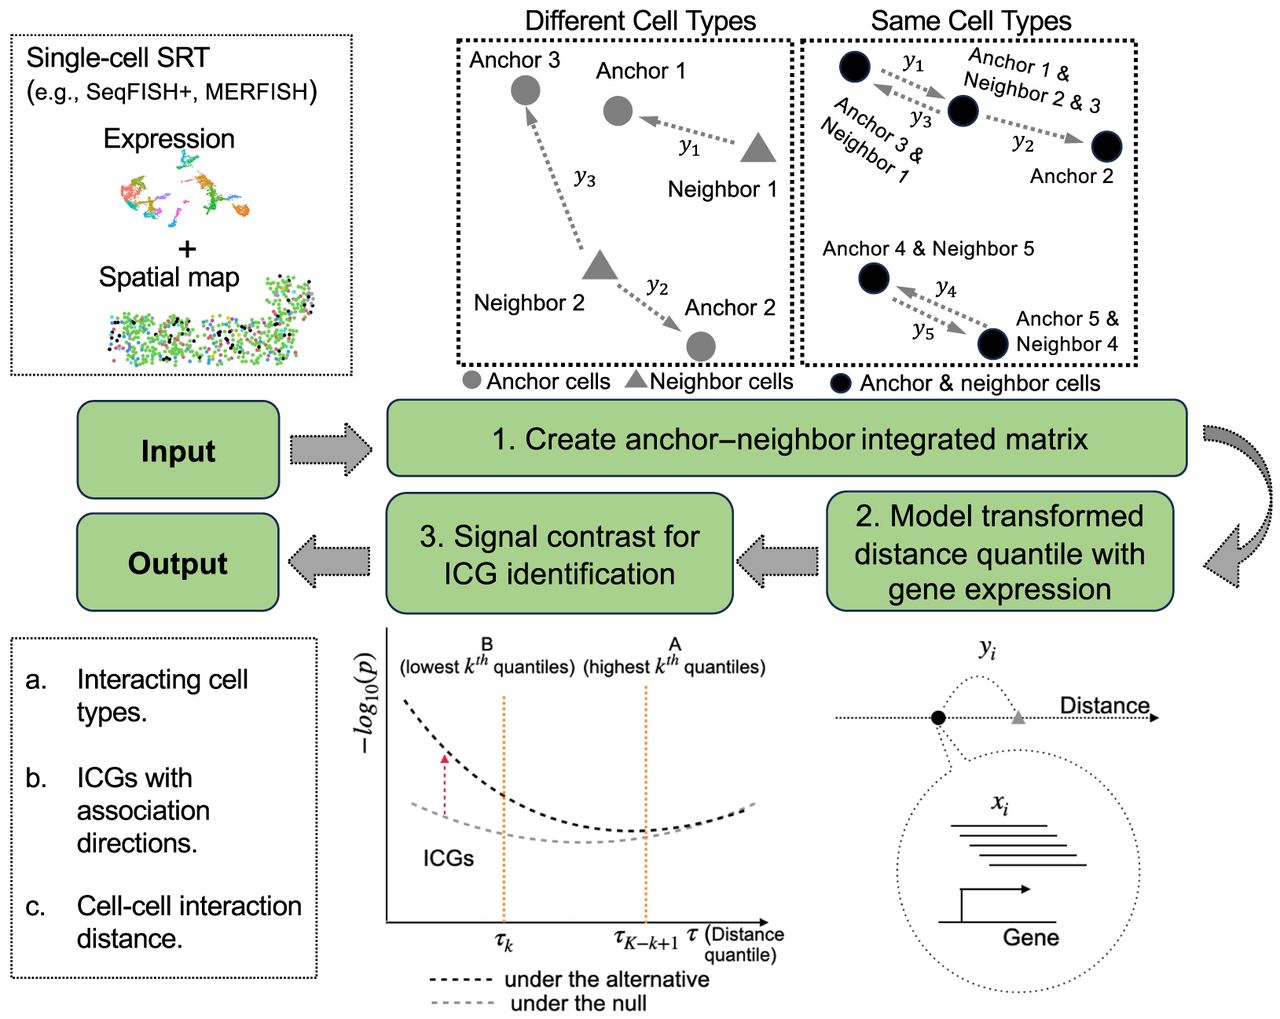
Figure 1.
Schematic overview of QuadST. Taking the spatial and transcriptomic data of single-cell SRT as input, QuadST creates an integrated matrix for each anchor–neighbor cell-type pair, models the association between expression and a weighted anchor–neighbor cell–cell distance at different distance quantile levels, and contrasts signal levels at different quantile levels to identify cell–cell interactions and their involved genes with well-controlled FDR.