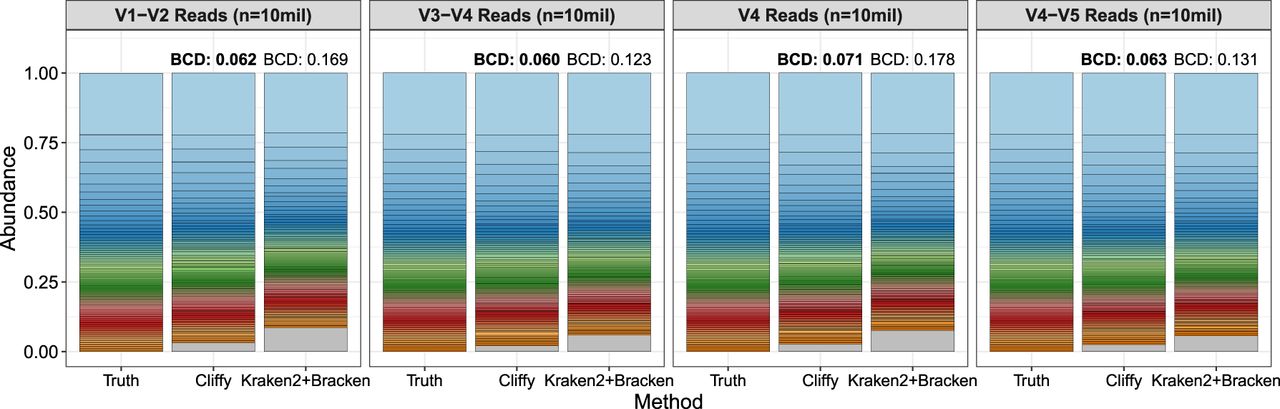
Figure 5.
Comparison of genera abundance estimates by Cliffy and Kraken2+Bracken on the aquatic data set. Shows the genera abundance results for Cliffy and Kraken2+Bracken for the aquatic data set compared with the truth distribution. Each stacked bar is compared quantitatively with the truth distribution through the Bray–Curtis distance (BCD). The method with the closest distribution to the truth (i.e., lowest BCD) is distinguished with a bold BCD value. The gray section of the Cliffy and Kraken2 bars corresponds to predicted genera that are not truly present in the data set.