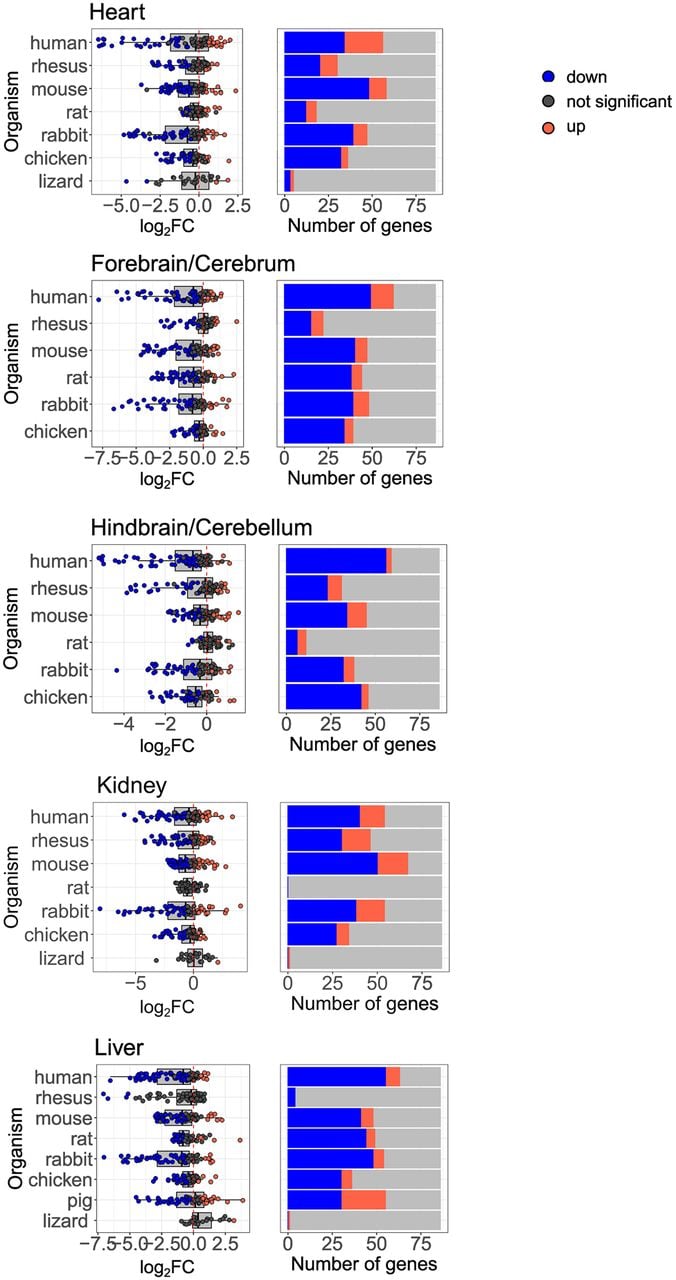
Figure 5.
Hypoxia response gene expression is generally reduced after birth. (Left) Box plots representing the log2FC of hypoxia genes. The x-axis indicates log2FC values; y-axis, organisms. Color bar: blue dots indicate significant downregulation (log2FC < −0.2, P-value < 0.05); red dots, significant upregulation (log2FC > 0.2, P-value < 0.05); and black dots, nonsignificant. The dashed vertical red line corresponds to the value of zero log2FC on the x-axis. (Right) Bar plots representing the number of significant (upregulated in red, downregulated in blue) or insignificant genes (in gray). The x-axis indicates number of genes; y-axis, organisms tested.