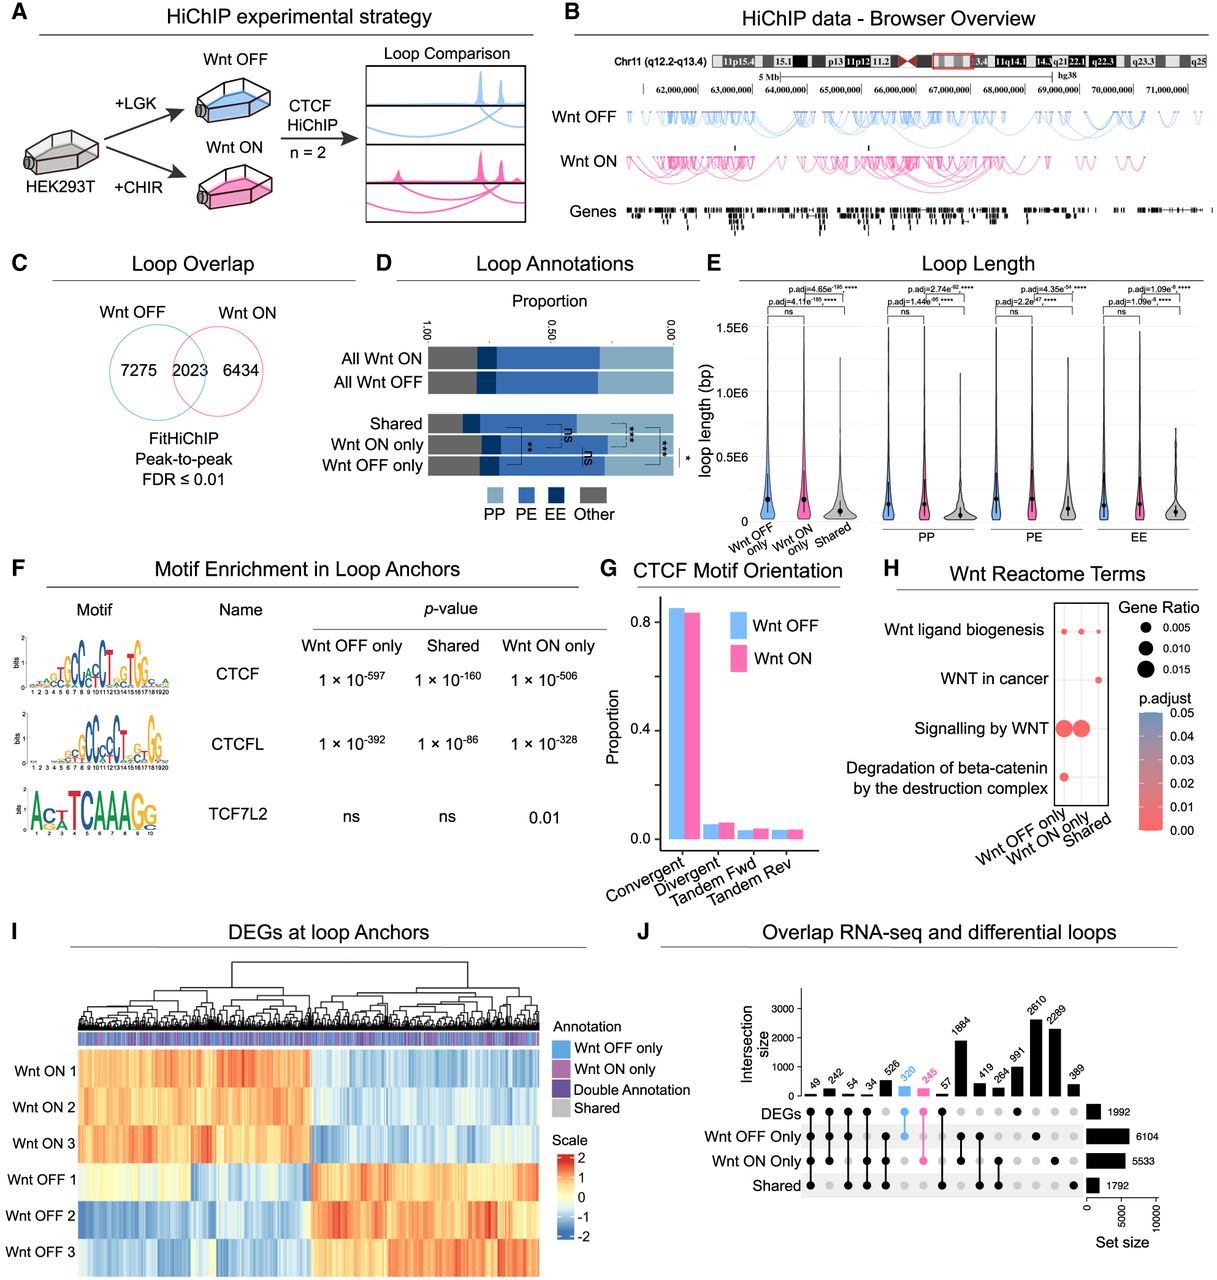
Changes in the CTCF interactome upon Wnt activation. (A) Experimental strategy of CTCF HiChIP for Wnt-OFF and Wnt-ON conditions (n = 2). (B) Genome browser visualization of significant CTCF HiChIP loops (FitHiChIP FDR ≤ 0.01) in a region of Chromosome 11 in Wnt-OFF and Wnt-ON conditions. (C) Loop overlap of significant loops in Wnt-OFF and Wnt-ON conditions, called combining valid pairs across replicates. (D) Annotations of all CTCF loops and differential loops (i.e., Wnt-ON/OFF-only, shared) as PP, PE, and EE interactions, where P and E denote promoter and enhancer, respectively. Benjamini–Hochberg adjusted P-values are depicted to highlight the significant differences in the proportion of P-P loops and P-E loops across the sets of Wnt-ON-only and Wnt-OFF-only loops, alongside the loops shared between both conditions. (*) P < 0.05, (**) P < 0.01, (***) P < 0.001. (E) Loop length analysis for all differential loops (Wnt-ON/OFF-only) (left) and differential loops grouped by loop annotation as PP, PE, and EE loops (right) (Supplemental Table S5). Statistical testing was performed using a t-test, with P-values adjusted for multiple comparisons using the Benjamini–Hochberg correction. (F) HOMER de novo motif analysis for CTCF, CTCFL, and TCF7L2 within differential loop anchors. (G) CTCF motif orientation analysis showing that >85% of loops, in both Wnt-OFF and Wnt-ON conditions, contain convergent CTCF motifs. (H) Enrichment dot plot of Wnt-related Reactome pathway terms within differential loops. The P.adjust values represent Benjamini–Hochberg corrected P-values from Fisher's exact test. (I) Heatmap displaying the expression of DEGs (FDR ≤ 0.01) annotated to differential loop anchors. (J) UpSet plot depicting the intersections between DEGs (FDR ≤ 0.01) (Doumpas et al. 2019) and genes annotated to the anchors of differential loops.