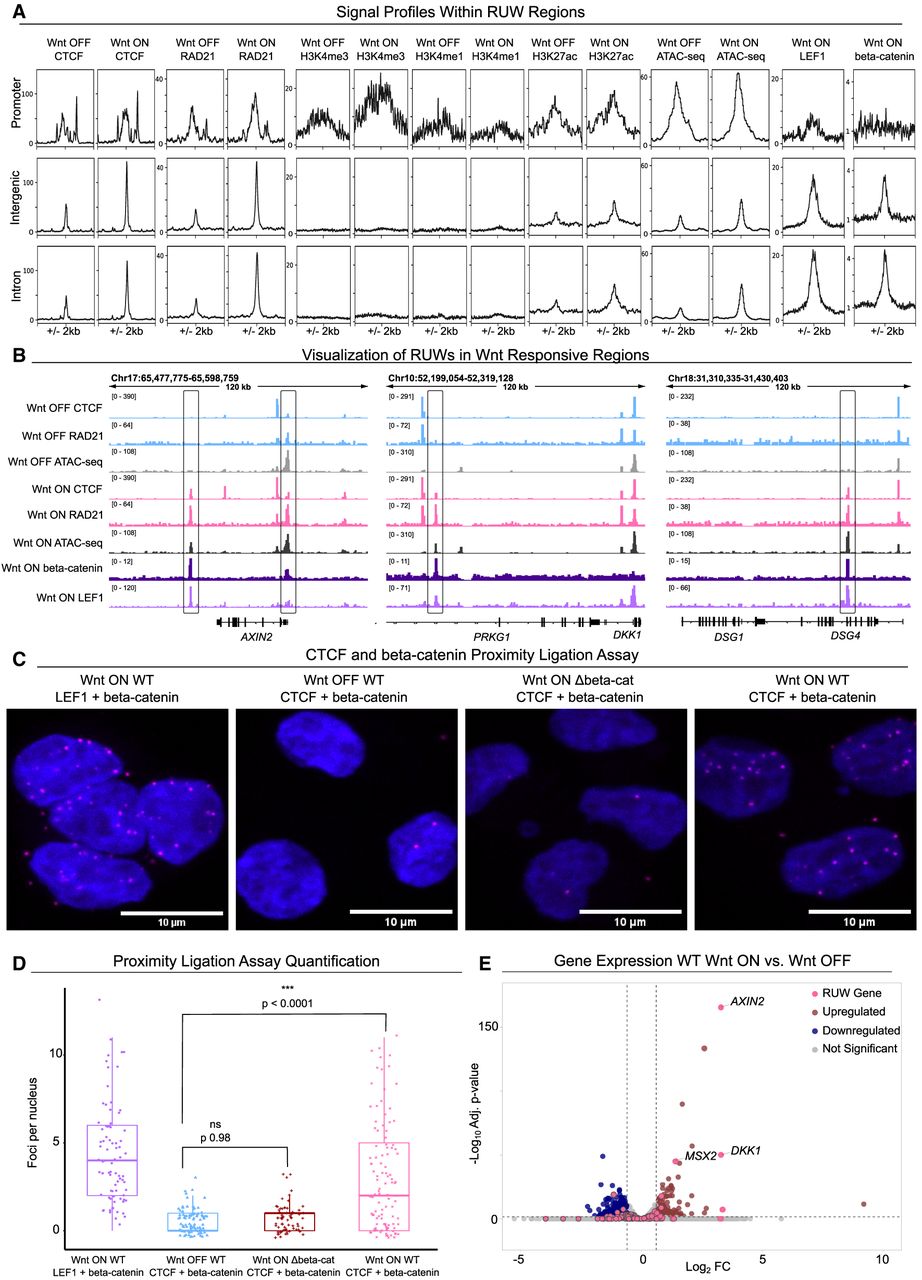
Characterization of RUW regions. (A) Signal intensity plots of CTCF, RAD21, H3K4me3, H3K4me1, H3K27ac, ATAC-seq, LEF1 CUT&RUN, and beta-catenin CUT&RUN within subsets of RUW peaks. (B) IGV tracks of RUW sites that show Tn5 accessible chromatin only in Wnt-ON, and beta-catenin, and LEF1 binding. (C) Representative microscopy images from the proximity ligation assay, showing LEF1 + beta-catenin in Wnt-ON, and CTCF and beta-catenin in Wnt-OFF, Wnt-ON Δbeta-catenin, and Wnt-ON WT. Scale bars 10 µM. (D) Quantification of proximity ligation assay (PLA) signal, in foci per nucleus. Wnt-ON WT had significantly more interactions than Wnt-OFF or Wnt-ON Δbeta-catenin. Counted nuclei = 354. (E) Volcano plot of differentially expressed genes (Log2FC > 0.5, adj. P < 0.05) in Wnt-ON versus Wnt-OFF.