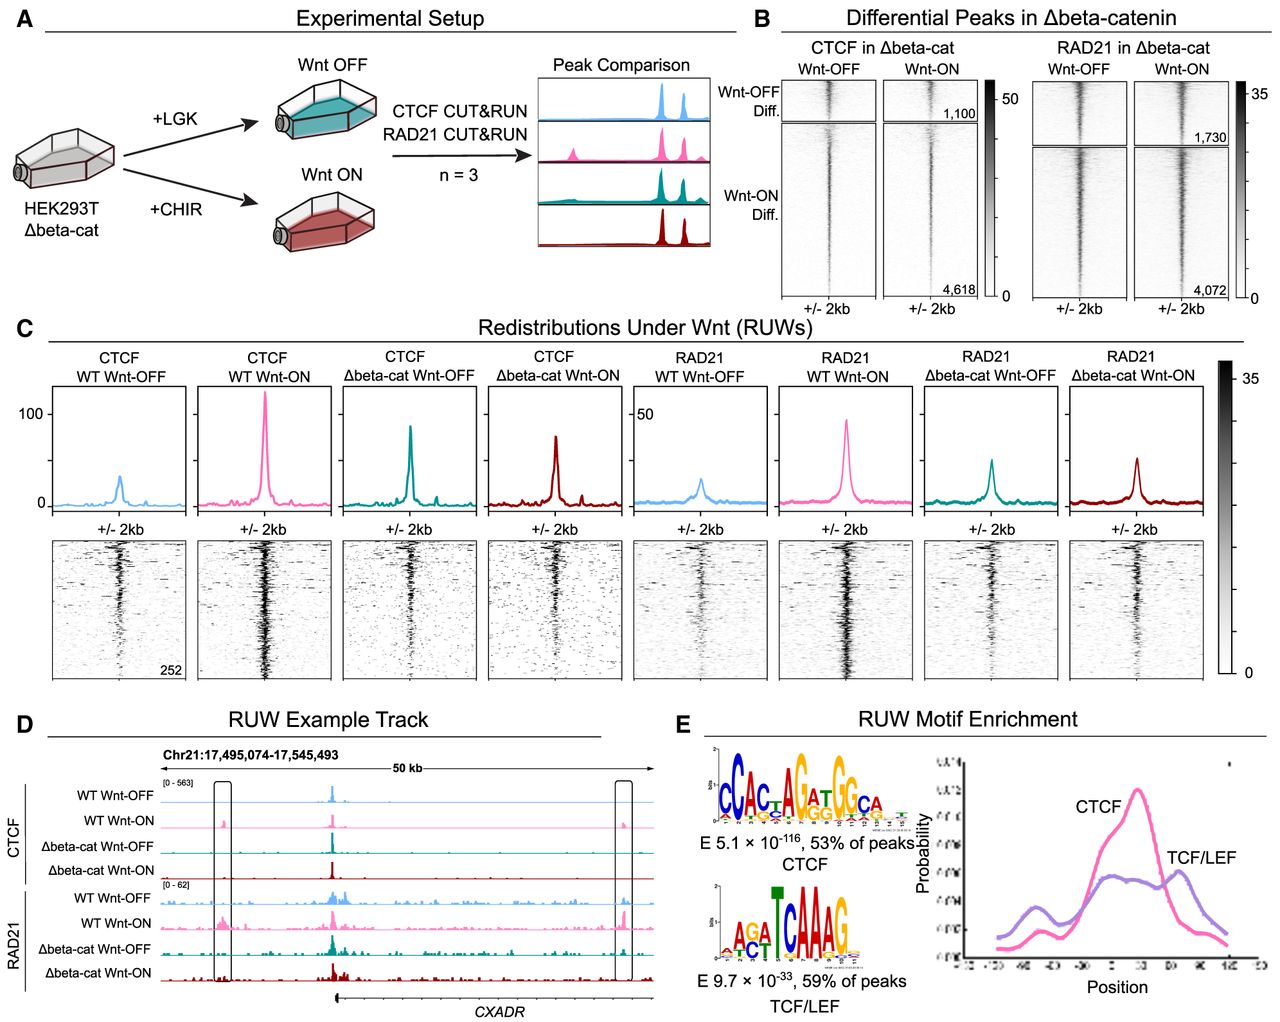
Figure 2.
Definition of Redistributions Under Wnt (RUW). (A) Schematic depicting the experimental strategy. (B) Signal intensity plots of CTCF and RAD21 Δbeta-catenin data sets over peak subsets differential in the WT cells. Δbeta-catenin cells do not show the same signal differences. (C) Peak average profiles showing CTCF and RAD21 signal within sites differentially occupied in Wnt-ON by both CTCF and RAD21 (Redistributions Under Wnt). (D) Visualization of genomic loci containing RUWs (CXADR locus). (E) De novo enriched motifs within RUWs matching CTCF (top) and TCF/LEF (bottom) and their centrality enrichment within the peaks (right).