Figure 2.
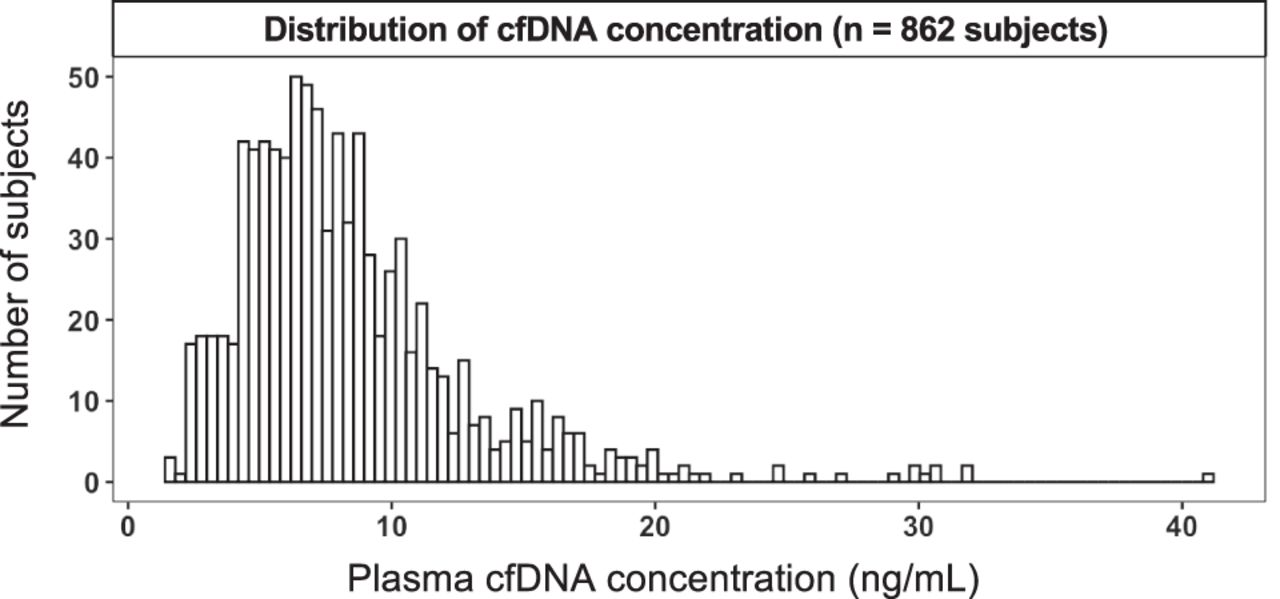
Frequency distribution histogram plot showing the distribution of plasma cfDNA concentration from 862 individuals of the study cohort.
Frequency distribution histogram plot showing the distribution of plasma cfDNA concentration from 862 individuals of the study cohort.