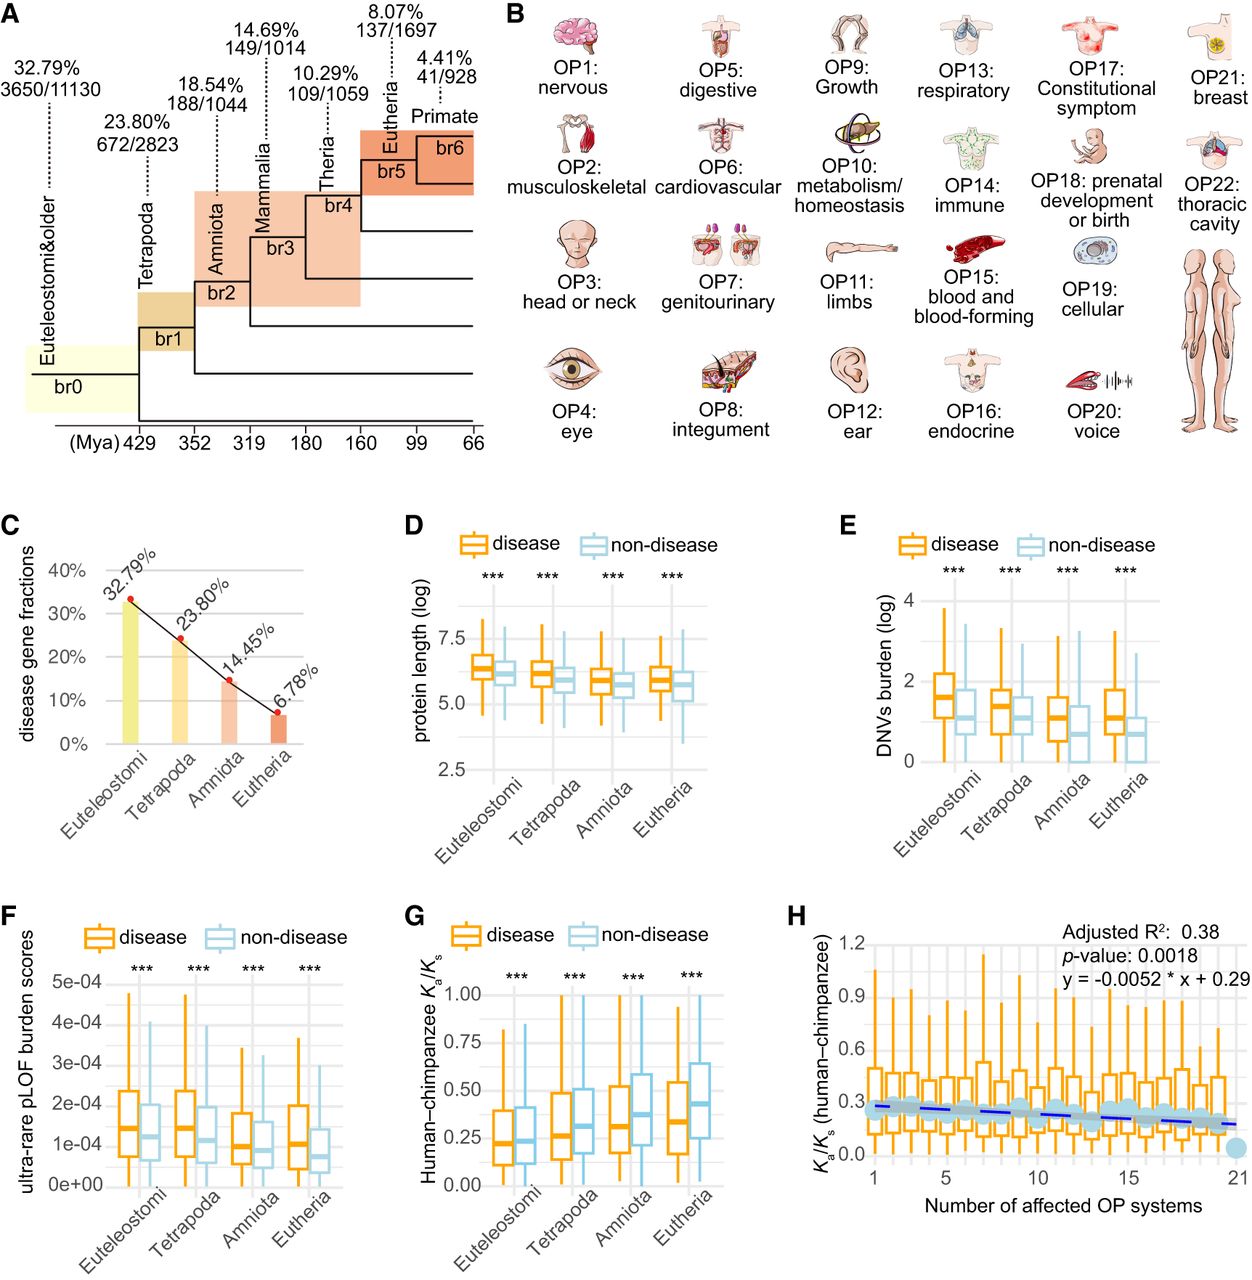
Number of genes, burdens of deleterious rare variants, and Ka/Ks ratios for genes categorized by gene ages (phylostrata) and disease systems (OPs). (A) The phylogenetic framework illustrating phylostrata and disease genes associated with disease systems (OPs). The phylogenetic branches represent phylostratum assignment for all genes and disease genes. The “br” values from br0 to br6 indicate different age groups (or branches). These are further categorized into four phylostrata to resolve the small number problem in br6 for some analyses. The horizontal axis depicts the divergence time sourced from the TimeTree database (July 2023). The numbers of total genes and disease genes and their ratios are shown for each phylostratum. (B) The 22 HPO-defined OPs, which are ordered based on the fraction of disease genes in a certain system out of all disease genes. (C) The fractions of disease genes at four major phylostrata from Euteleostomi to Eutheria. (D) The protein lengths between disease and nondisease genes across four phylostrata. (E) The gene-wise burden based on de novo germline variants from the Gene4Denovo database (Zhao et al. 2020) between disease and nondisease genes across four phylostrata. (F) The burden score of ultrarare pLOF variants (Weiner et al. 2023) between disease and nondisease genes across four phylostrata. (G) The pairwise Ka/Ks ratios from the Ensembl database based on maximum likelihood estimation for “one-to-one” orthologs between human and chimpanzee. Only genes under purifying selection are shown (Ka/Ks < 1, 3226 genes). (H) The box plot for the number of affected systems for disease genes and their pairwise Ka/Ks ratios for “one-to-one” orthologs between human and chimpanzee (Ka/Ks ratios for all 3369 genes). The linear regression is based on median values and the number of affected tissues, with the statistical details and formula displayed in the upper right corner. Note that all significance levels of comparisons between disease genes and nondisease genes are determined using the Wilcoxon rank-sum test. (***) P < 0.001.