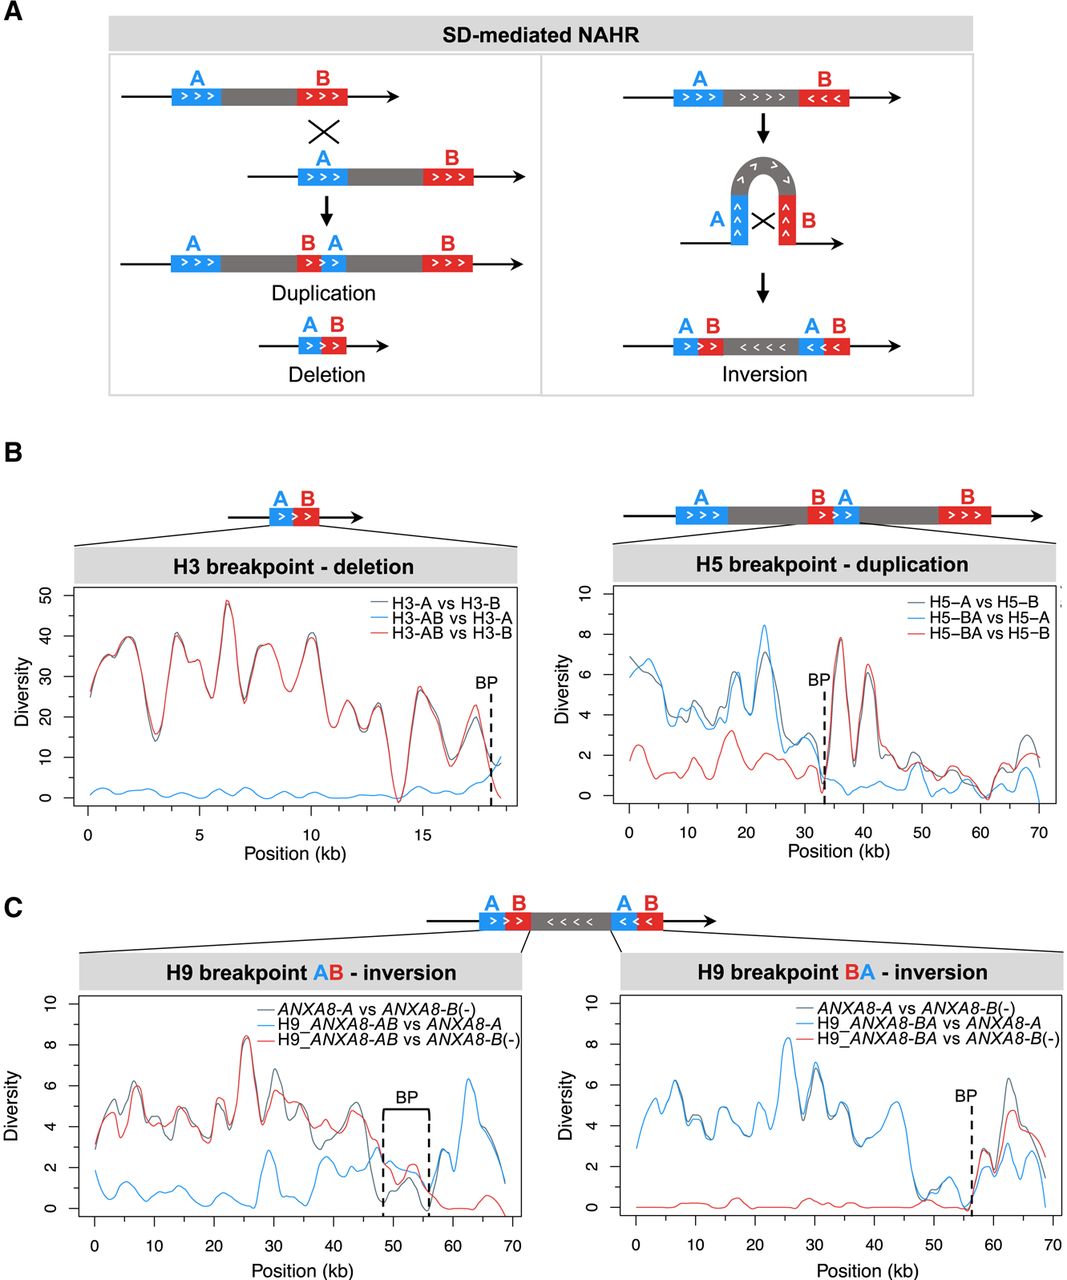
Characterization of rearrangement breakpoints in H3, H5, and H9 haplotypes. (A, left) Schematic of interchromosomal or interchromatid NAHR between directly oriented SDs resulting in reciprocal duplication and deletion. The misalignment of two directly oriented SDs—block A (blue) and block B (red)—produces two chromatids: one carrying a duplication and the other a deletion of the sequence between them (gray), as well as of the SDs themselves. In the chromatid with the duplication, the new SD copy is a “chimera,” with the first portion derived from the downstream SD (B, red) and the second portion from the upstream SD (A, blue). Conversely, in the chromatid with the deletion, the remaining SD copy is a “chimera,” with the first portion derived from the upstream SD (A, blue) and the second portion derived from the downstream SD (B, red). The switch from A to B (or vice versa) corresponds to the exact NAHR site. (Right) Schematic of intrachromatid NAHR between SDs with inverted orientation generating an inversion. The misalignment of two SDs with inverted orientation—block A (blue) and block B (red)—generates an inversion of the sequence between the SDs (gray), as well as two hybrid “AB” SDs, with each copy having an A-derived and a B-derived portion. The switch site between the A and B blocks depends on the position of the NAHR breakpoint. (B) Diversity plots of H3 and H5 breakpoint regions compared with the putative SDs mediating the deletion/duplication. The plots show the sliding window pairwise diversity between the H3/H5 breakpoint regions (H3-AB, H5-BA) and the original “A” (blue line) or “B” (red line) SDs. The gray line refers to the comparison between the parental SDs (H3-A vs. H3-B; H5-A vs. H5-B), as a reference. The dashed line indicates the location of the breakpoint, which is the point where the derived hybrid SD copy switches similarity from one copy (H3-A or H5-B) to the other (H3-B or H5-A) of the original SDs. (C) Diversity plots of H9 breakpoint regions compared with the putative SDs mediating the inversion. Diversity plots of the H9 ANXA8-AB duplicon (left) or H9 ANXA8-BA duplicon, reverse strand (right) compared with the H1 ANXA8-A (blue line) or ANXA8-B (red line) duplicons. The gray line refers to the comparison between H1 ANXA8-A and ANXA8-B duplicons, as a reference. Dotted lines designate the breakpoint region.