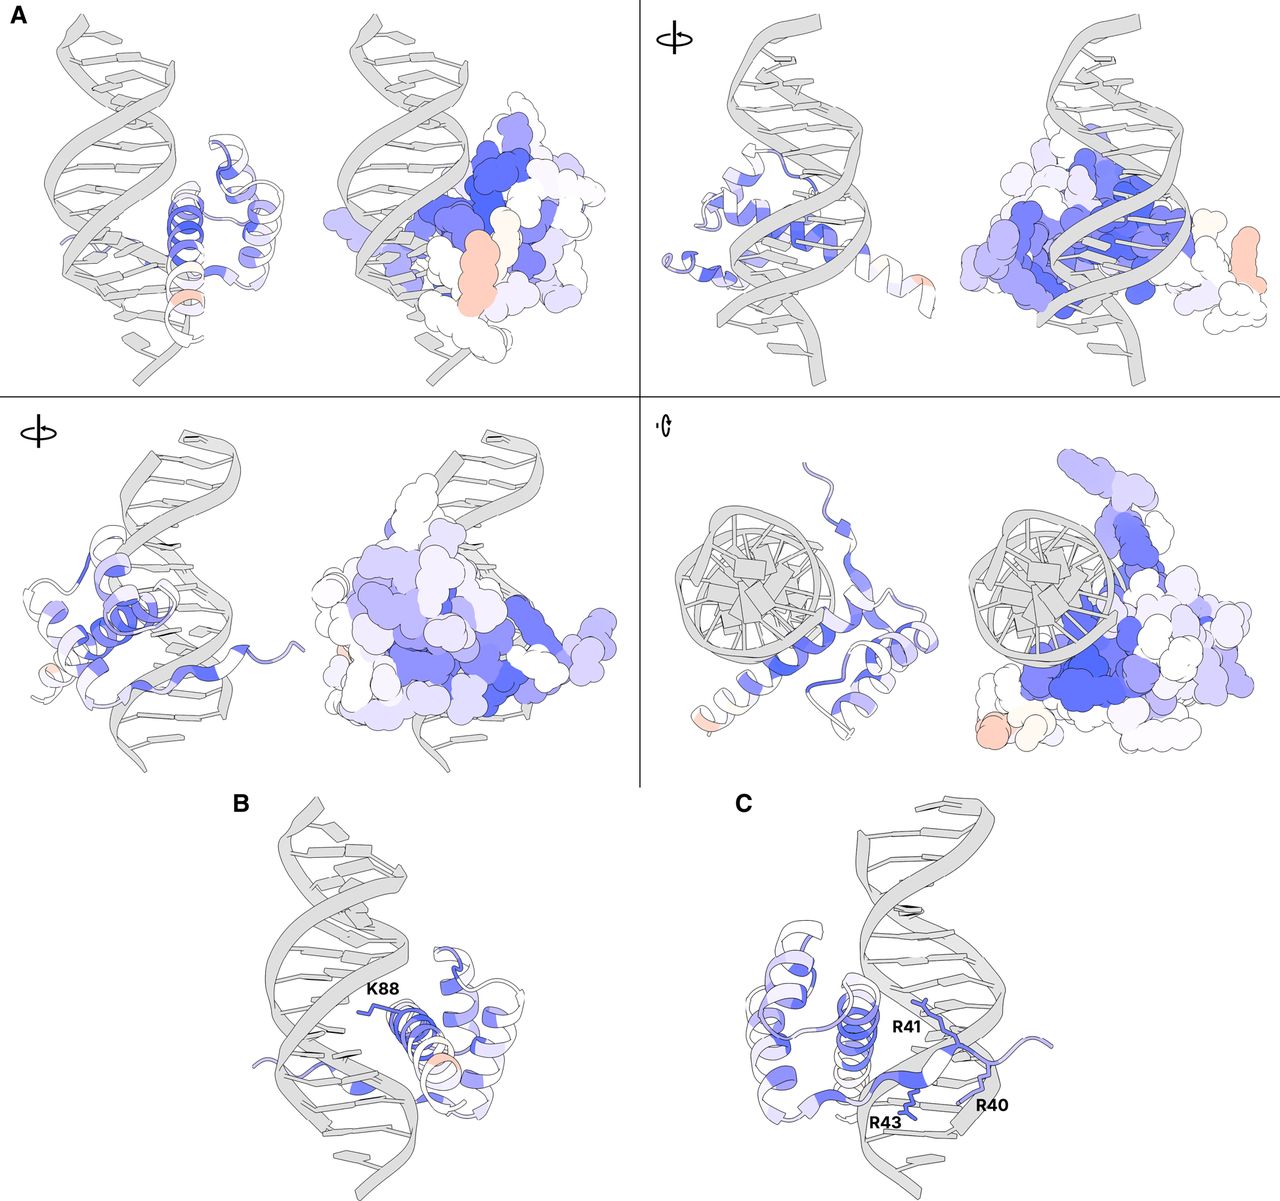
Average DMS activity scores superimposed on a predicted structure of the CRX homeodomain in complex with DNA. (A) Various views of residues 38–104 of an AlphaFold predicted structure of CRX aligned to a crystal structure of Drosophila paired in complex with DNA (PDB 1FJL) (Wilson et al. 1995). For each view, a cartoon ribbon model is shown on the left and a space-filling atomic model is on the right. Supplemental Movie S1 animates a 360° rotation of this structure. (B) Close-up of residues in the major groove with K88 highlighted (side chain shown). (C) Close-up of minor groove-contacting residues with arginine residues highlighted (side chains shown). In all panels, residues are colored by the average DMS activity score, as shown in the “Average” track in Figure 2.