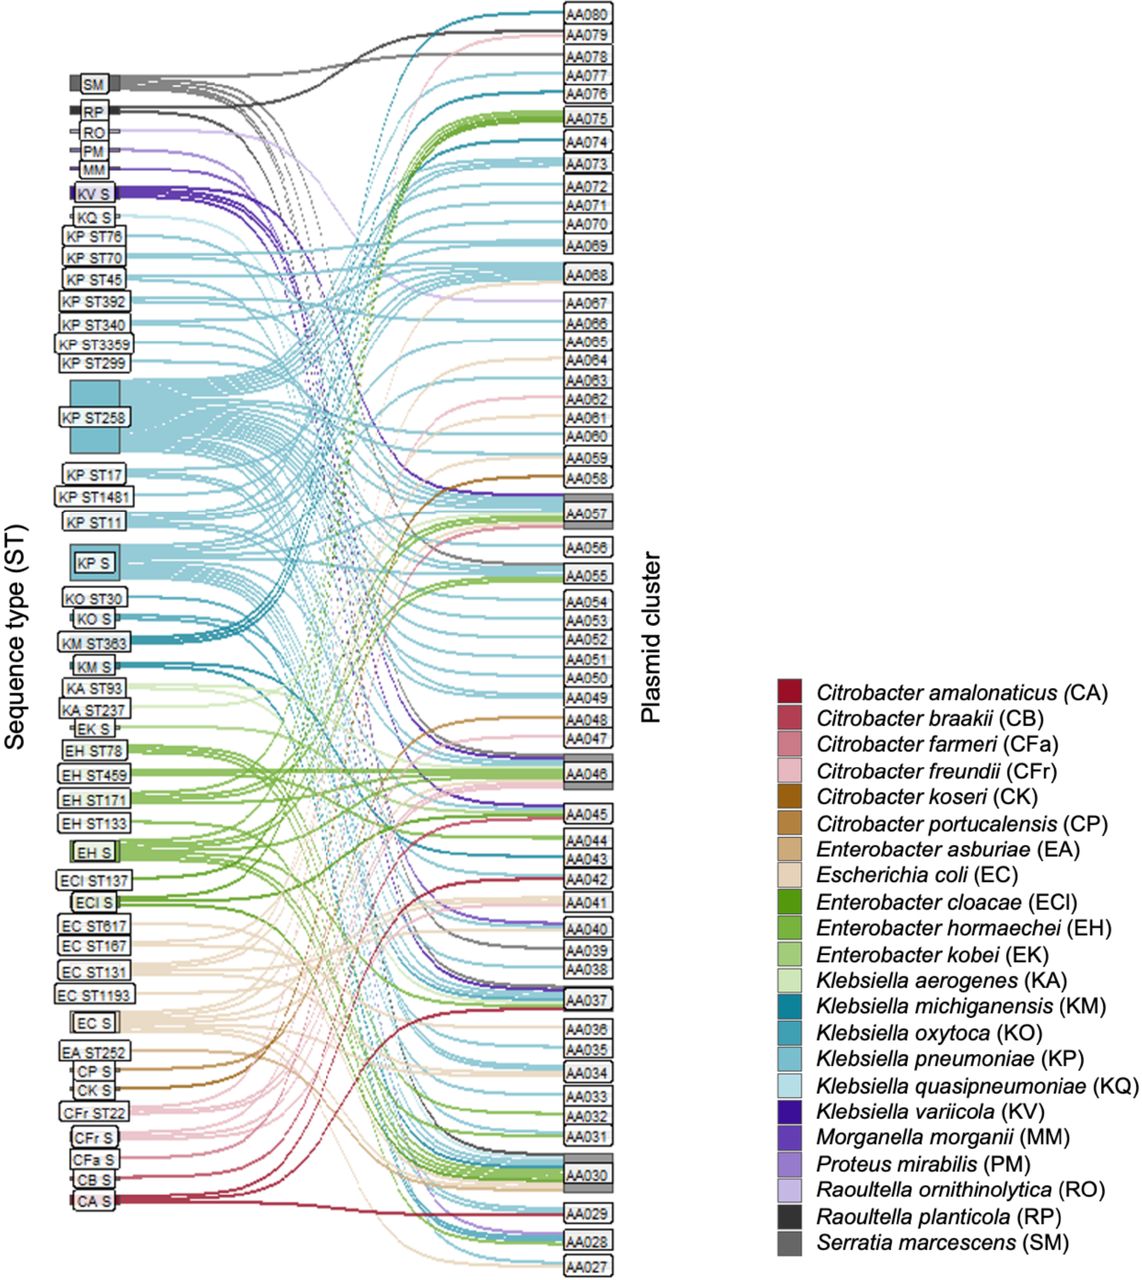
Figure 3.
Plasmid distribution across different CRE STs. This Sankey plot demonstrates the relationship between isolated STs and plasmid clusters found in this collection; bacterial species are designated by color, demonstrating the host range for each plasmid cluster. STs consisting of only one isolate are labeled as singletons (S). Bar sizes correspond to the number of plasmids in each ST and plasmid cluster.