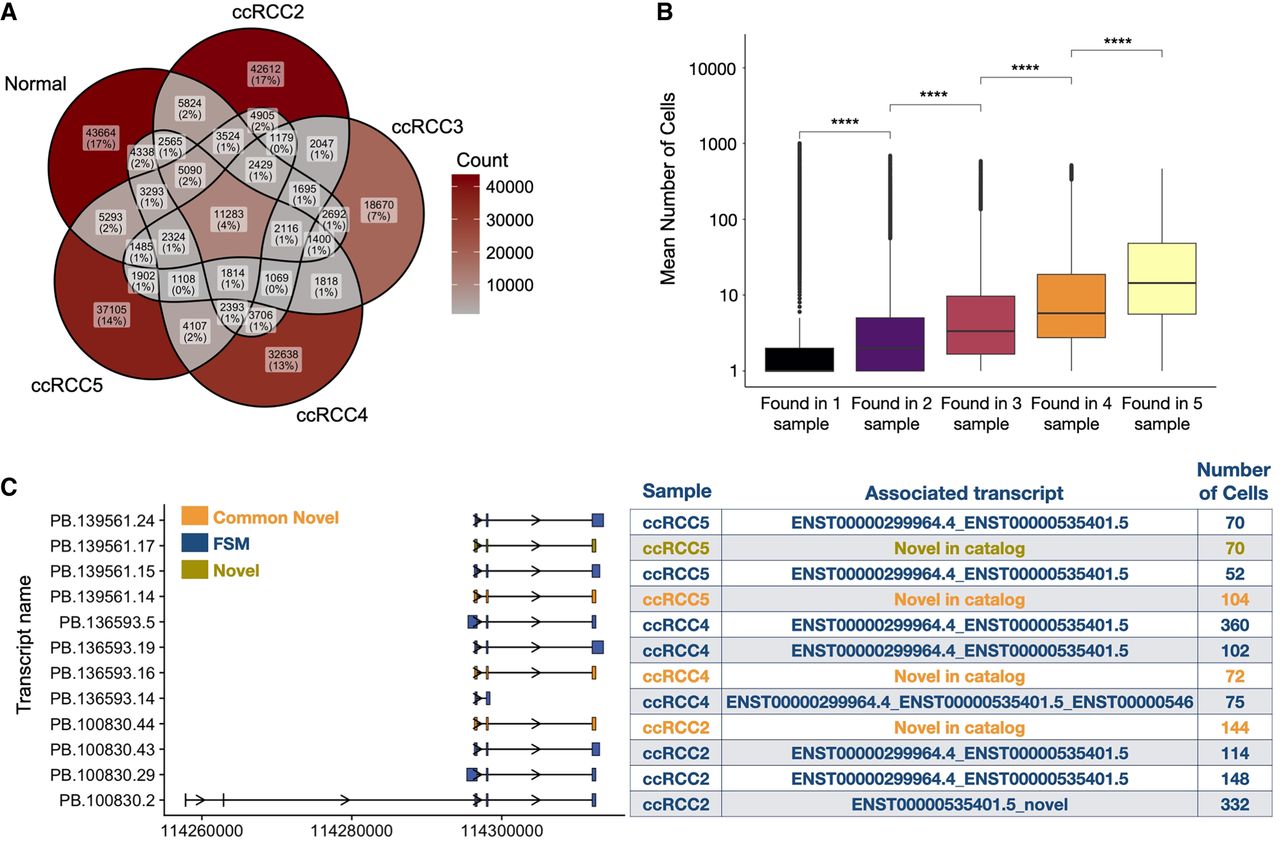
Shared transcripts across samples. (A) The number of overlapping transcripts across all samples. (B) Box plots showing the mean number of cells a transcript was found in a sample on average (Wilcoxon test, P < 2.2 × 10⁻¹⁶). (C) The top four transcripts of NNMT are based on the number of cells across ccRCC2, ccRCC4, and ccRCC5 and their exon structures (left panel). The commonly found novel transcripts from ccRCC2, ccRCC4, and ccRCC5 are depicted in orange, FSM transcripts are shown in blue, and a distinct novel transcript from ccRCC4 is highlighted in yellow. The table next to the transcript structures lists the SQANTI3 categories, aligned reference transcripts, and the number of cells in which the transcripts were identified (right panel).