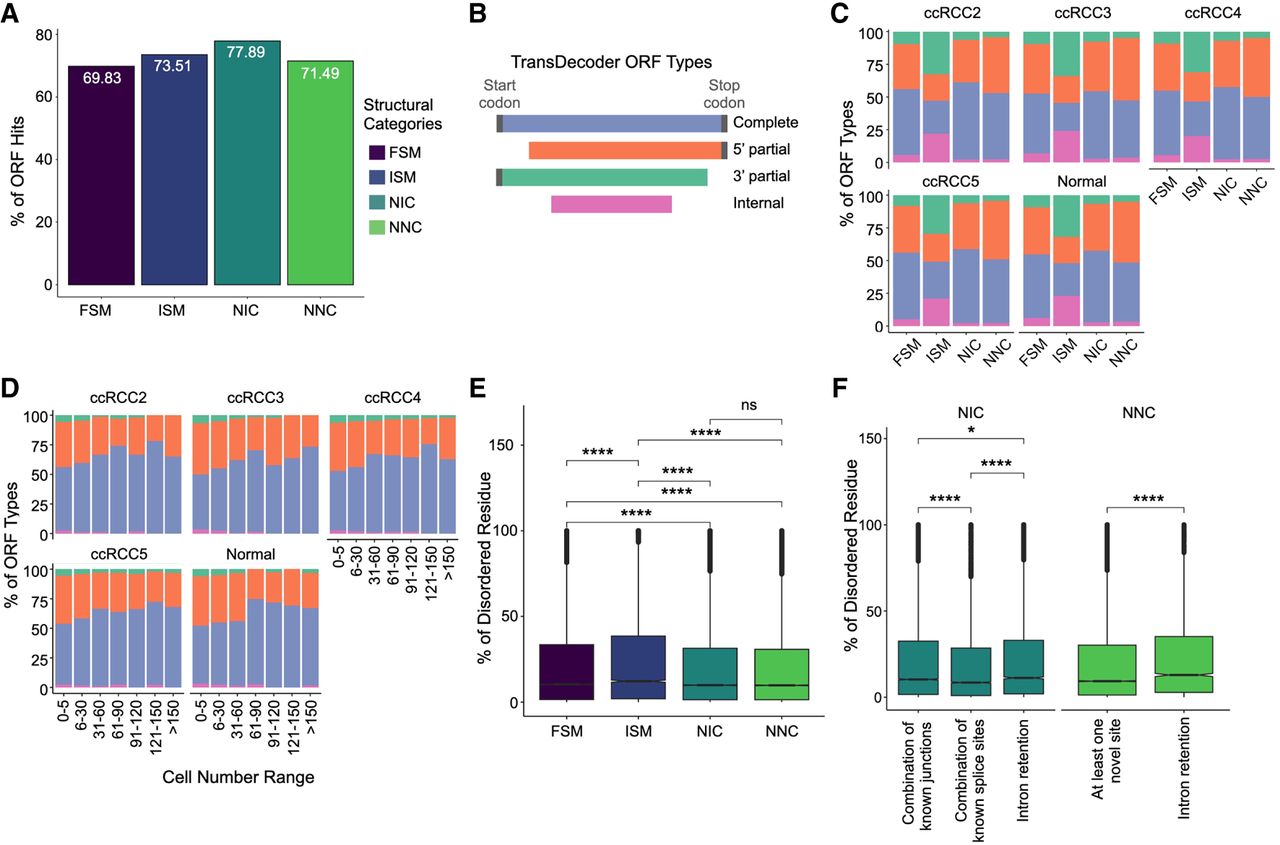
Distribution of ORF categories and intrinsically disordered protein predictions. (A) Percentage of ORF hits across different structural categories in all data sets. For the percentage of ORF hits across isoform subcategories, see Supplemental Figure 2A. (B) ORF types predicted by TransDecoder. (C) The fraction of different ORF types across data sets in each structural category. Each color represents various ORF types. (D) Distribution of ORF types in novel transcripts as a function of cell number range across data sets. The x-axis categorizes the cell number range, while the y-axis shows the proportion of each ORF type (see B for the legends). (E) Comparison of disordered scores for the protein sequences of complete-ORF transcripts across structural categories. (F) Comparison of disordered scores for the protein sequence of NIC and NNC showing complete ORFs across different substructural categories. For the percentage of disordered region scores across FSM subcategories, see Supplemental Figure 2B.