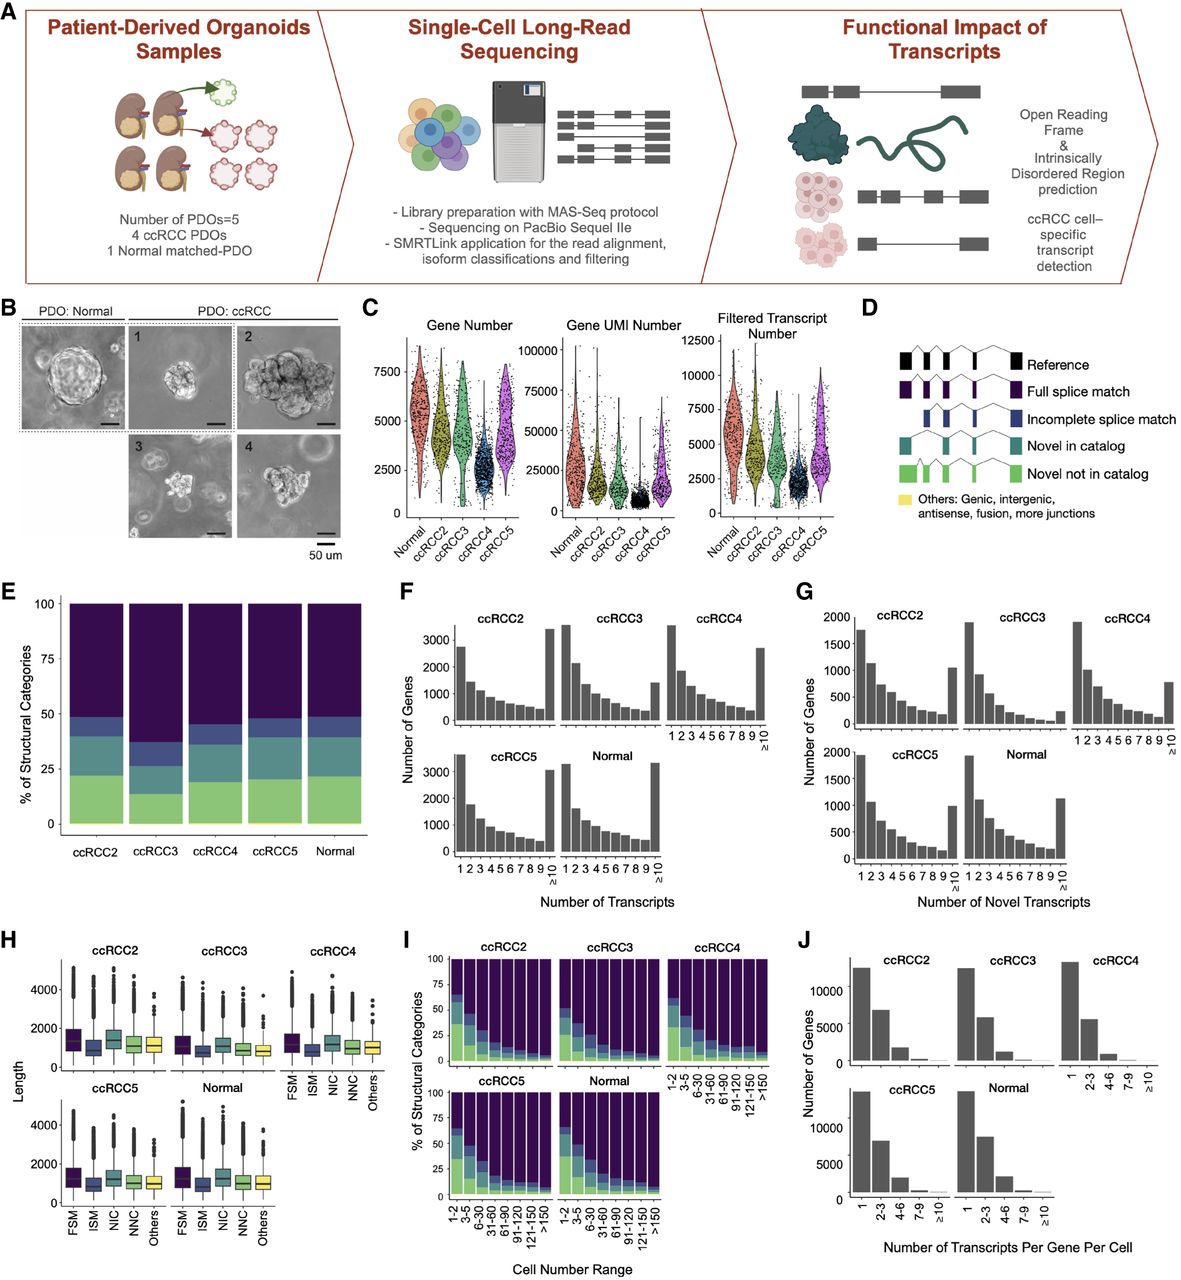
Transcript landscape and cell heterogeneity in Normal and ccRCC-PDOs. (A) Schematic design of the project showing how PDO samples are established, sequenced using single-cell long-read sequencing, and functionally characterized (illustrations were created by BioRender [https://www.biorender.com]). (B) The bright-field representative images of our organoids. The dotted line marks the matched pair. Scale bar, 50 μm. (C) Distribution of the number of genes, UMI counts, and filtered transcript numbers across samples. (D) SQANTI3 transcript categories. (E) The proportion of transcript categories found across four ccRCC-PDO and one normal PDO (see C for the color code). (F) The number of identified transcripts per gene in each PDO. The x-axis denotes the number of transcripts per gene, categorized into bins (1, 2, 3, 4, 5, 6, 7, 8, 9, and ≥10), while the y-axis represents the number of genes. The height of each bar reflects the count of genes that express the corresponding number of transcripts. (G) The number of identified novel transcripts per gene per cell in each PDO. The x-axis shows the number of transcripts detected per gene per cell, categorized into different bins, while the y-axis denotes the total number of genes, with the height of each bar reflecting the count of genes that express the corresponding number of transcripts per cell. (H) Distribution of transcript lengths for each structural category across samples. (I) Proportional distribution of identified transcripts’ structural categories across cell number ranges. (J) Number of transcripts per gene per cell across samples, categorized into bins (1, 2–3, 4–6, 7–9, and ≥10).