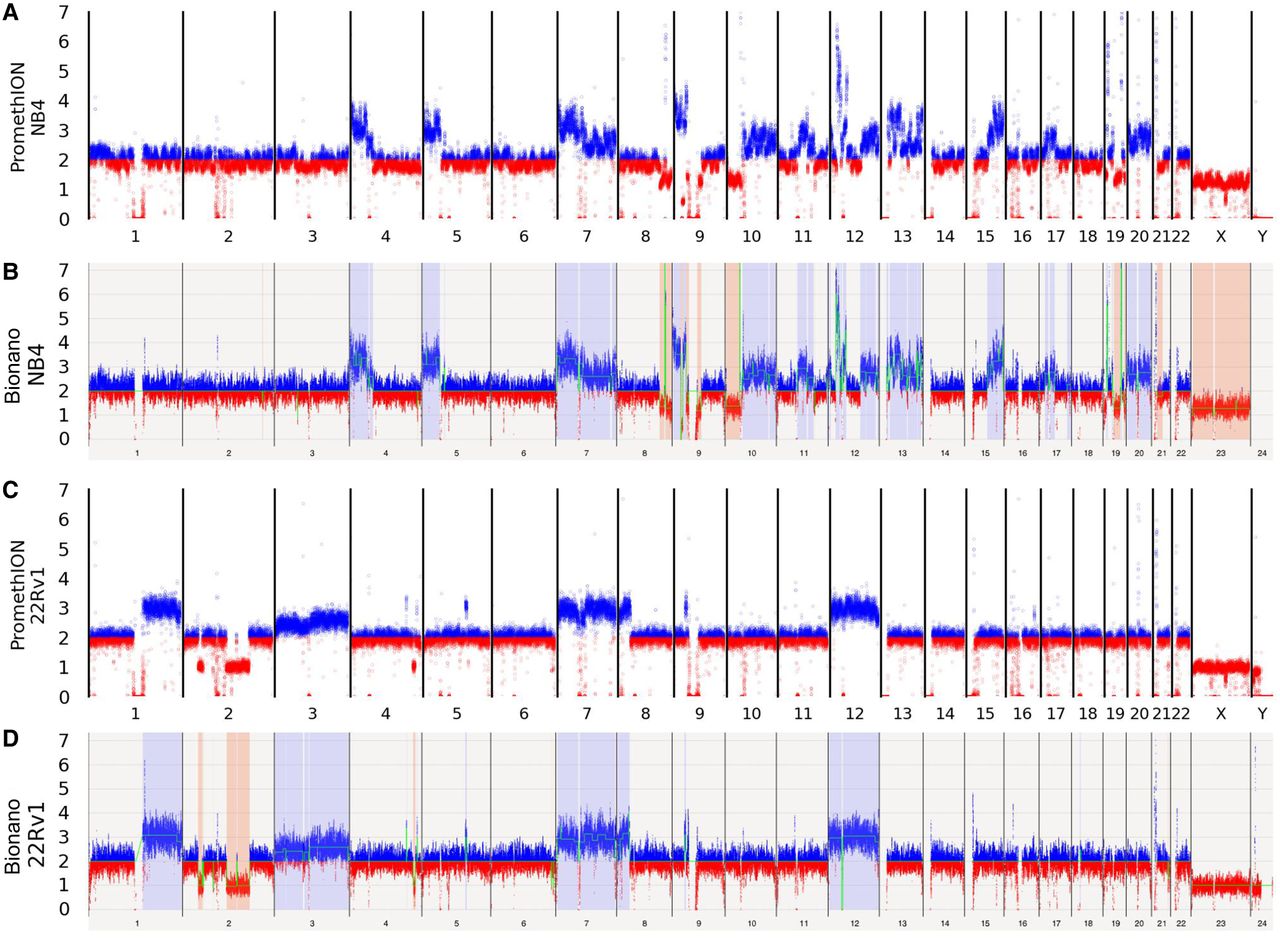
Figure 4.
Matched ONT and Bionano CNV visualization. Nanopore sequence data from PromethION compared with Bionano optically mapped reads, all mapped against GRCh38 (hg38). Blue points show where binned data indicates greater than expected copy number, red points where binned data indicates lower than expected copy number. (A) NB4 PromethION sample compared with (B) showing Bionano optical mapping data for this cell line. (C) 22Rv1 PromethION sample compared with (D) showing Bionano optical mapping data for this cell line.