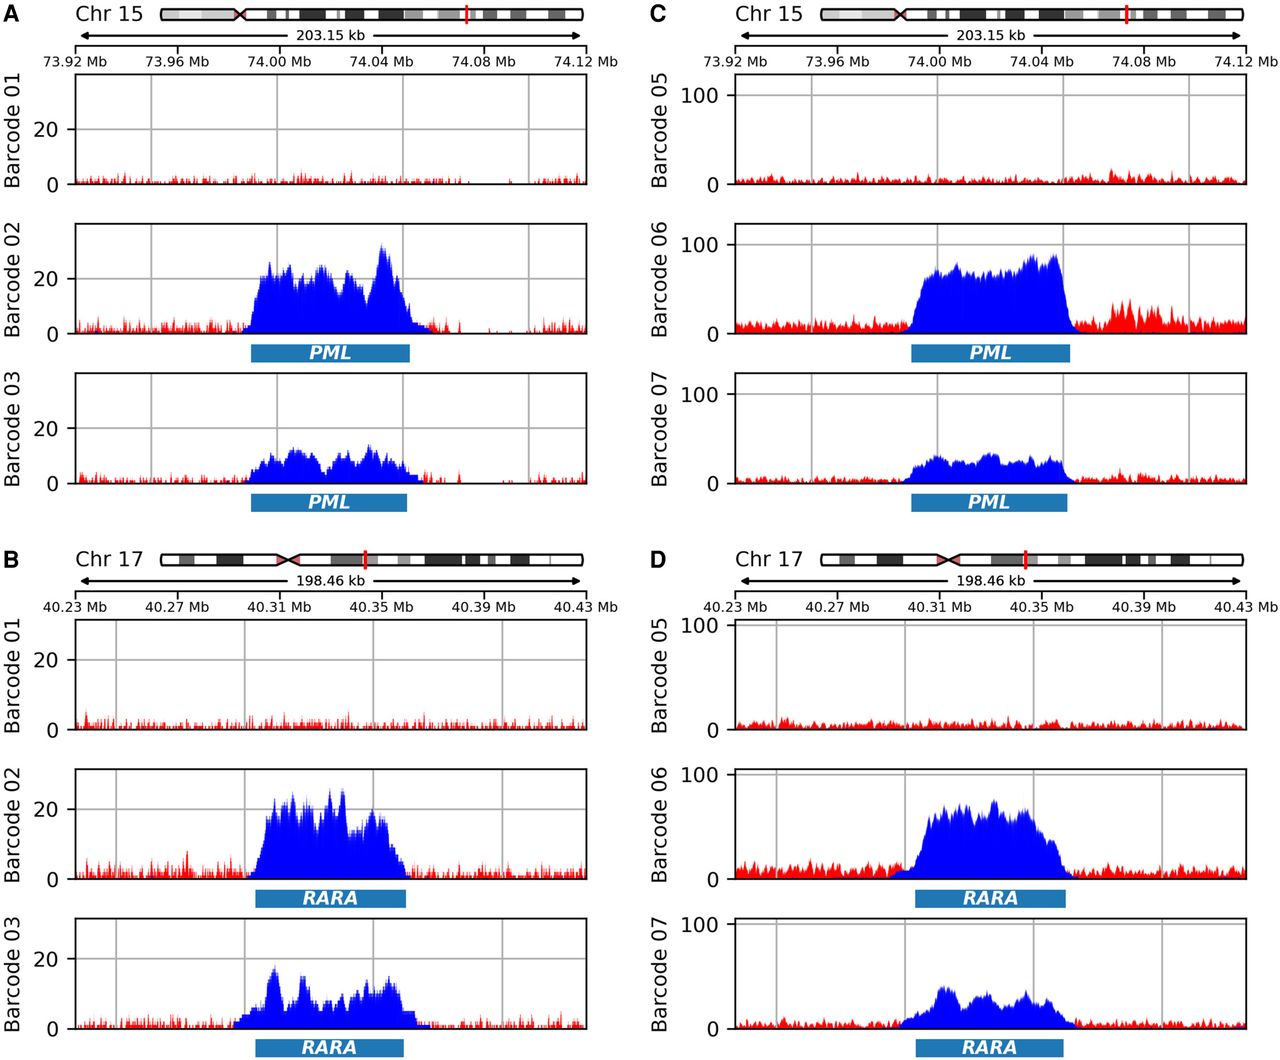
Figure 2.
Target and barcode-specific gene coverage. Illustration of coverage over each barcoded sample for the target genes PML and RARA. Blue is coverage from accepted read; red illustrates coverage from rejected reads. Barcodes 01 and 05: samples prepared from NA12878 cells; Barcodes 02 and 06: NB4; and Barcodes 03 and 07: 22Rv1. (A,B) Data generated on a single MinION flow cell. The targeted regions are illustrated below the coverage plots. (C,D) Data generated on a single PromethION flow cell.