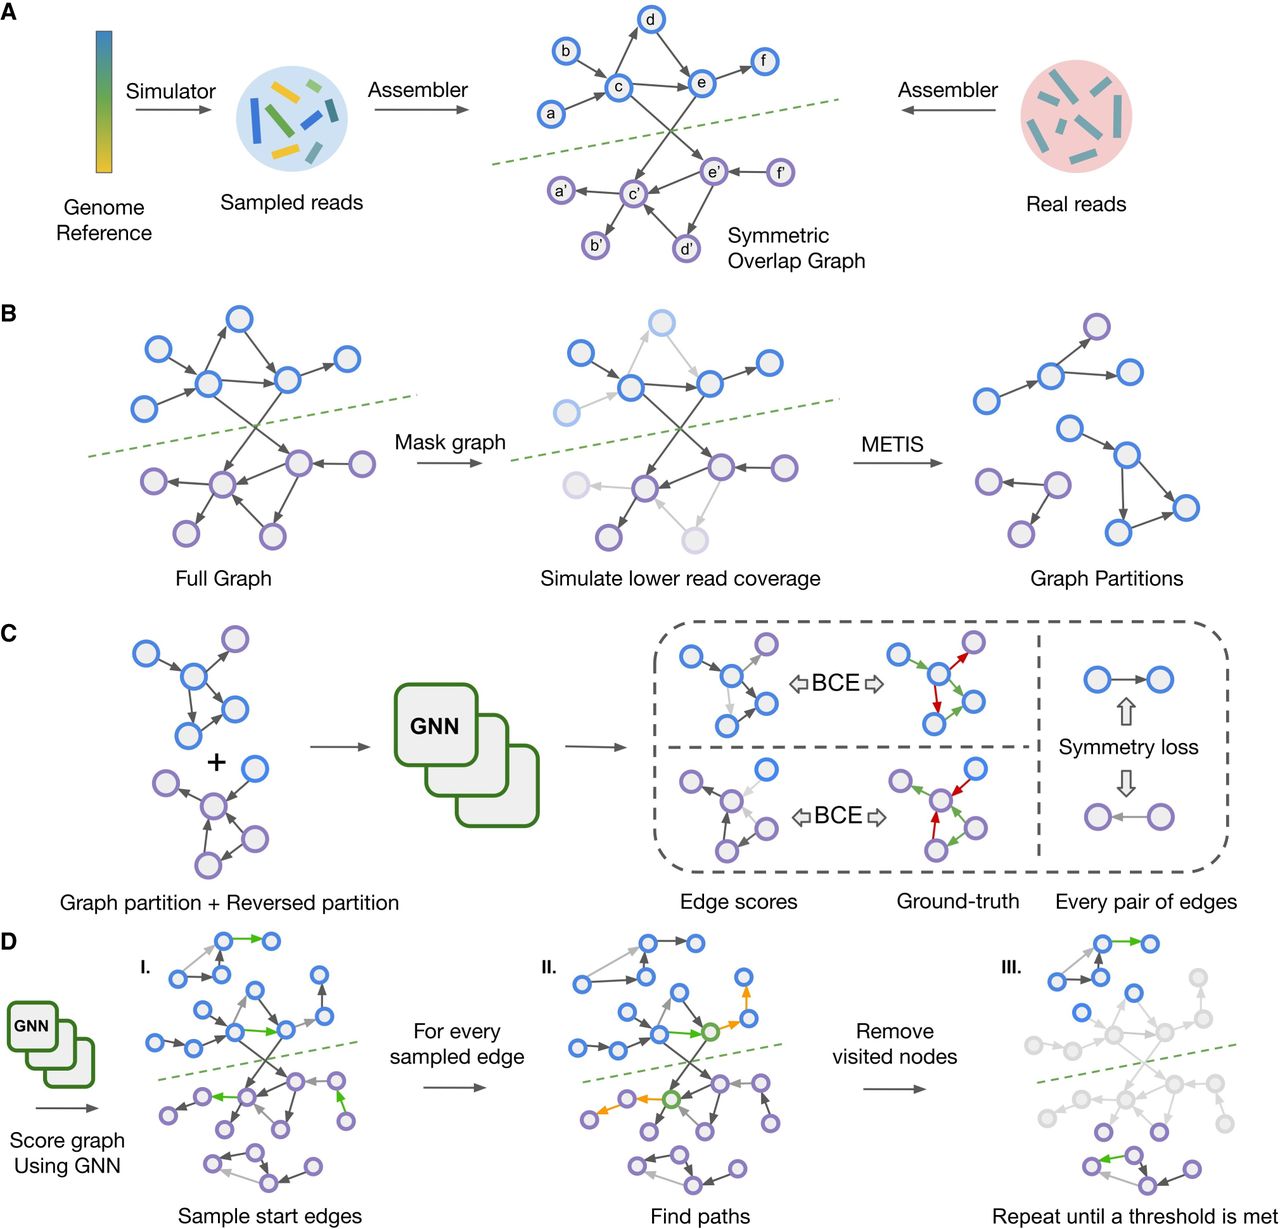
Schematic visualization of the training and decoding pipeline. (A) Generating and processing of the synthetic reads for training and real reads for inference. Different colors of the simulated reads indicate that their positions on the reference genome are known, unlike the positions of the real reads. The green dashed line shows the line of mirror symmetry. (B) Data augmentation during training. The grayed-out nodes and edges are the ones that are masked. (C) Training the model by computing the strand-wise symmetric loss over the edges. The shade of the edges indicates the values of the scores, while red and green colors indicate negative/positive edge labels. (D) Iterative decoding on a new graph during inference. Green nodes indicate the starting edges for walks, and orange edges represent the steps taken by a decoding algorithm. The grayed-out nodes and edges represent the ones that are previously traversed and are thus discarded in the next iteration of the decoding algorithm.