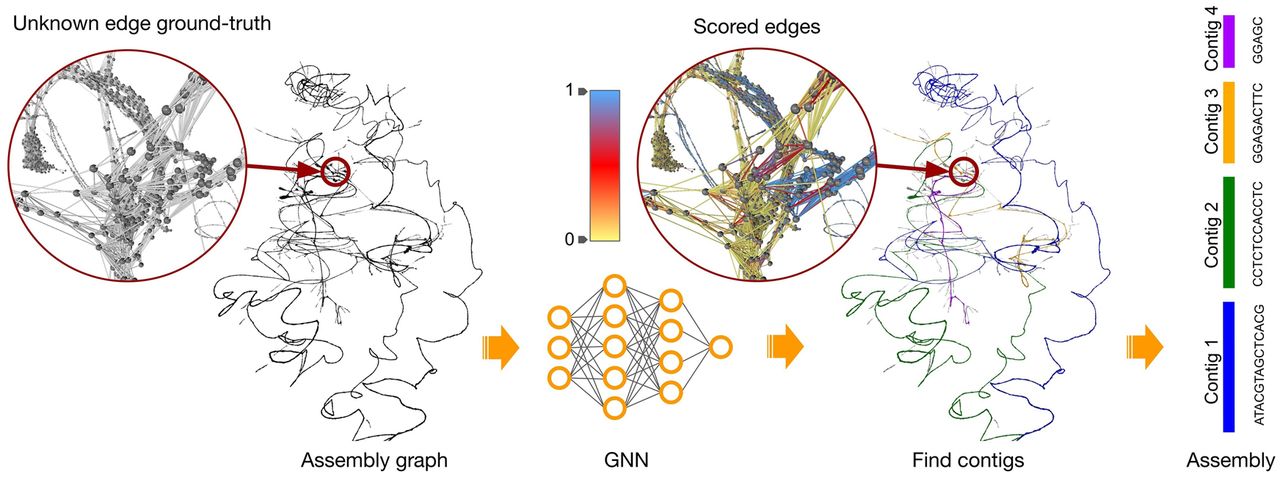
Figure 1.
Overview of the assembly workflow with GNNome. An assembly graph is passed to a trained neural network which produces a probability for each edge. The probabilities are visualized in the zoomed-in region in the middle, with the color scheme that increases the visibility of the edges with probability ∼0.5. The graph shown here represents entangled Chromosomes 21 and 22 of CHM13 (Nurk et al. 2022) generated with hifiasm (Cheng et al. 2021), as well as the four longest contigs found by GNNome. The graph was visualized with Graphia (Freeman et al. 2022).